
Foundations · Track 1 · Tutorial 5 of 6
See your first consolidated statements
With every company loaded and mapped, your group figures are ready. Open the consolidated statements, see what each company contributes, and check that the balance sheet balances.
1Check your setup is complete
- Open Settings → Global Settings → Setup Progress.
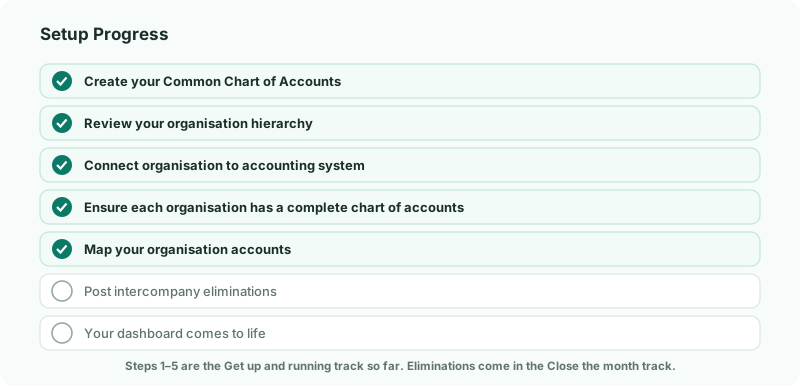
The first five steps should be ticked. If one is not, open it from the list — it takes you to the page that needs finishing.
2Choose the month
- Select your group in the entity selector.
- In the reporting month control in the header, choose the latest month that every company has loaded.
In the running example, Companies A and B sync every night, but Company C only has the months you uploaded. If Company C’s latest file is September, choose September — in October, Company C would be missing from the group.
Saving a mapping recalculates the group figures in the background. While that runs, a thin teal line pulses under the header — wait for it to stop before you read the figures.
3Open the consolidated profit and loss
- Open Reports → Profit & Loss.
- Turn on Show Entities.
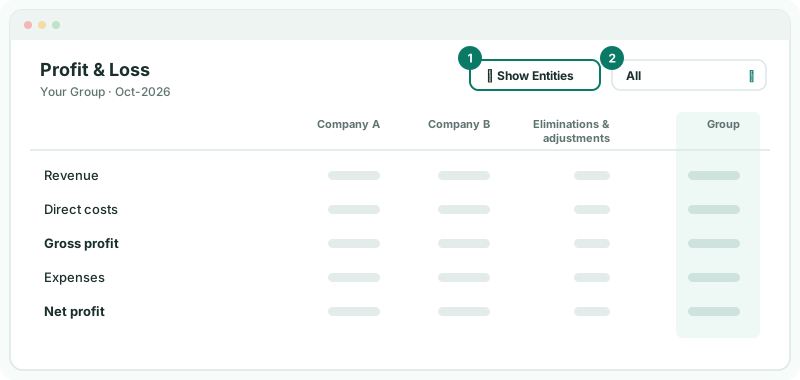
Each company gets its own column, with a column for the group’s eliminations and adjustments, beside the consolidated figures. The company columns are already in the group currency, so they add across to the group total.
Read across each line rather than down. An empty company column, or a line where one company is far out of proportion, is the quickest sign that a month is missing or an account is mapped to the wrong line.
The eliminations filter next to it switches between All, Exclude Eliminations and Eliminations Only. Until you post eliminations in the Close the month track, sales and charges between your companies are counted on both sides — if Company A invoices Company B a management fee, the group shows it as both revenue and expense.
Check
Every company has a column with figures in it.
4Check the balance sheet balances
- Open Reports → Balance Sheet.
- Compare NET ASSET with EQUITY.
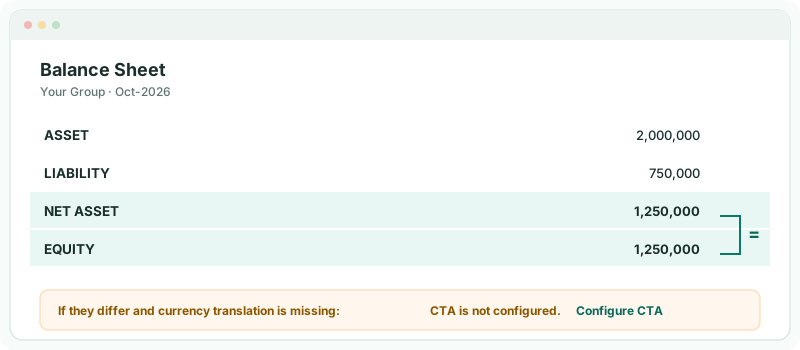
Each company’s own balance sheet balances, so the group’s should too. When it does not, something has gone missing on the way in: a month not loaded, an account not mapped, or a currency not translated.
In the running example, Companies B and C report in Australian dollars and pounds. Their balance sheets are translated at the closing rate and their profit at the average rate, and the difference has to go to a translation reserve. Until that is set up, the report shows CTA is not configured. with a Configure CTA link. The Close the month track covers it; for now, the message tells you the gap is expected.
Check
NET ASSET equals EQUITY — or, with companies in other currencies, the only difference is the one the CTA message explains.
5Read the cash flow
- Open Reports → Cashflow.
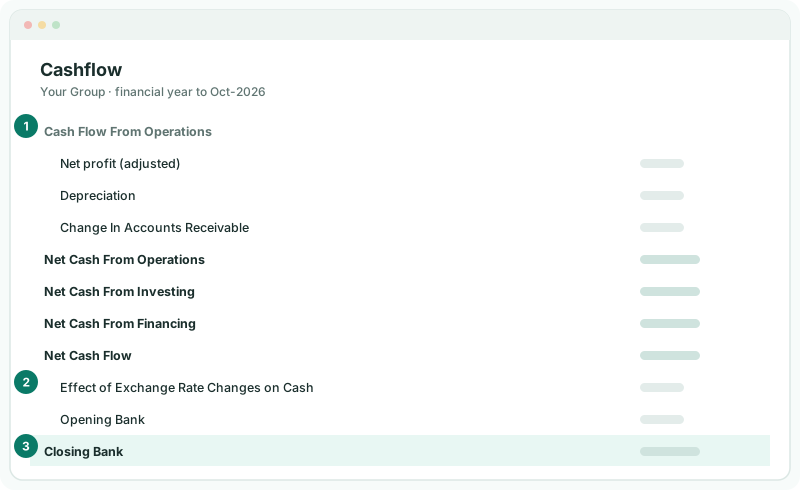
Nobody enters a cash flow. BrizoConsol builds it for the financial year up to the month you chose, starting from profit and adding the movement in each balance sheet section — this is why the sections you checked in Map every company to one group chart of accounts matter here.
| 1 · Operations, investing, financing | Operations starts from profit, adds back depreciation, and adjusts for changes in receivables, inventory, payables and the other current sections. Investing comes from the fixed and non-current asset sections; financing from equity and loans. |
|---|---|
| 2 · Effect of exchange rate changes | Company B’s and Company C’s bank balances are translated at a different rate each month, so the group’s cash moves even when theirs does not. This line shows that difference. |
| 3 · Closing Bank | The total of the BANK section at the end of the month. |
Check
Closing Bank equals the bank total on the Balance Sheet for the same month. If a company’s bank account is missing from it, that account is mapped to a group account outside the BANK section.
6Look behind any figure, and keep a copy
Click any amount to see the postings behind it, company by company — the same drill-down you used in Take a tour with the demo group. Use it whenever a figure is not what you expect.
To share a statement, use Export to PDF or Export to Excel in the report’s header. The three statements are always in the Reports menu; for the full library, open All Reports.
7If something does not look right
| What you see | What to do |
|---|---|
| A company’s column is empty | That month is not loaded for it. Check its Data Loading page, or choose an earlier month. |
| NET ASSET and EQUITY differ, with CTA is not configured. | Expected for companies in another currency until CTA is set up in the Close the month track. |
| NET ASSET and EQUITY differ, with no message | Open Account Mapping and finish any pending accounts, and check that no balance sheet account has been ignored. |
| A figure sits on the wrong line | Drill into it to find the company account, then correct its mapping in Account Mapping. |
| Group revenue and expenses look too high | Sales and charges between your companies are not eliminated yet. That comes in the Close the month track. |
| Figures have not changed after a fix | Wait for the teal line under the header to stop, then reload the report. |
Want more detail? See the documentation