
Foundations · Track 1 · Tutorial 1 of 6
Take a tour with the demo group
Create a ready-made demo group and see how BrizoConsol turns three companies into one set of group figures. Nothing you do here touches real data, and you can reset the demo whenever you like.
1Create the demo group
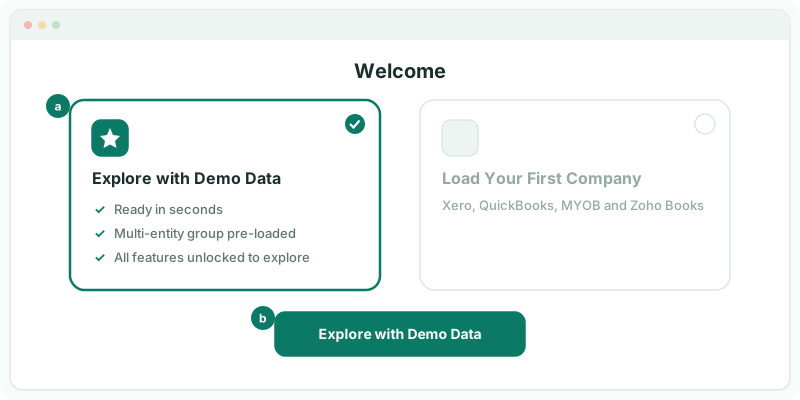
When you log in before adding a company, BrizoConsol opens on the Welcome screen.
- Select Explore with Demo Data.
- Click the Explore with Demo Data button at the bottom of the screen.
A progress window lists each part of the demo as it is built — the companies, the group chart of accounts, intercompany transactions, budget and forecast, exchange rates, eliminations, and the reports and insight packages. When it finishes, a short guided tour opens. Follow it now or close it; you can open it again any time from the account menu in the top right, under Guided Tour.
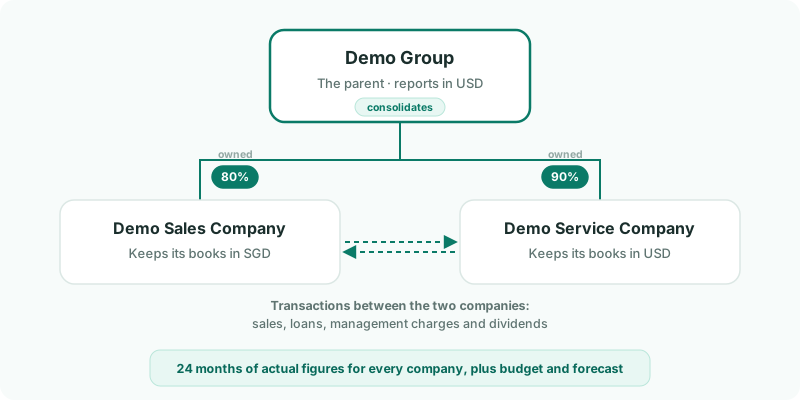
What the demo contains
| Demo Group | The parent. Reports in USD and consolidates the two companies below. |
|---|---|
| Demo Sales Company | Keeps its books in SGD. The group owns 80%. |
| Demo Service Company | Keeps its books in USD. The group owns 90%. |
| History | 24 months of actual figures for every company, plus a budget and forecast. |
| Group activity | Sales, loans, management charges and dividends between the companies, with the rules that eliminate them; SGD to USD exchange rates; and the currency translation and minority interest entries that follow. |
| Ready-made outputs | Group dashboards, the standard financial statements, and two insight packages: Monthly Pack and Board Pack Example. |
The demo’s reporting month is the last full month before the day you create it.
2Find your way around
Four things on screen are worth knowing first:
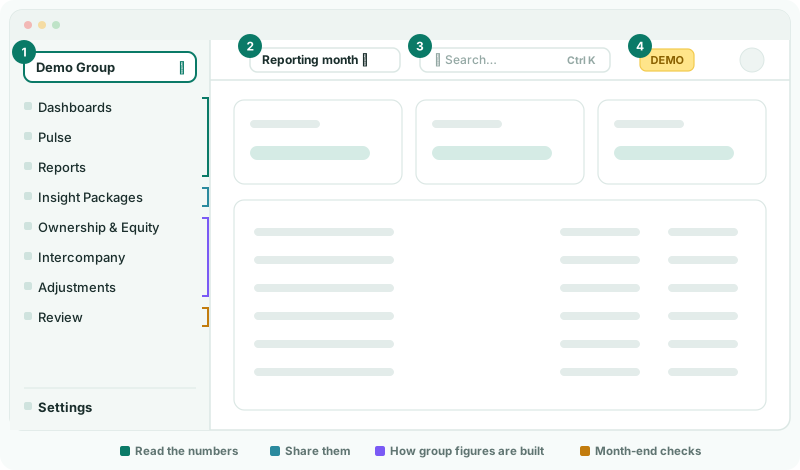
| 1 · Entity selector | At the top of the left-hand menu. Choose Demo Group for the consolidated figures, or one of the companies for its own figures. Every dashboard and report follows your choice. |
|---|---|
| 2 · Reporting month | In the header. Changes the month for the whole screen. |
| 3 · Search | In the header, or press Ctrl + K (⌘ + K on Mac) to jump straight to a report, dashboard or account. |
| 4 · DEMO badge | Reminds you that you are in the demo. Click it to reset or remove the demo — see step 7. |
The left-hand menu is grouped by what you do: Dashboards, Pulse and Reports to read the numbers; Insight Packages to share them; Ownership & Equity, Intercompany and Adjustments for how the group figures are built; and Review for month-end checks. Settings, at the foot of the menu, holds the setup behind it all.
3Read the group dashboard
- Make sure Demo Group is selected in the entity selector.
- Open Dashboards → Main.
The Main dashboard shows the consolidated group for the reporting month — revenue, profit, cash and the companies driving them. In the demo it also includes a Sales by Customer table, built from the sales company’s customer and product data.
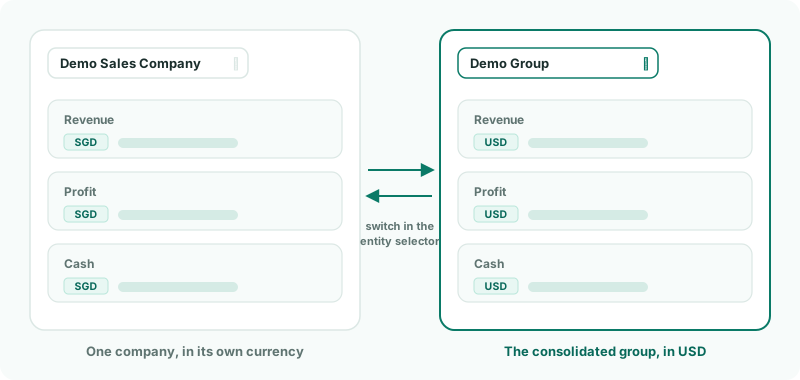
Now switch the entity selector to Demo Sales Company, then back to Demo Group. Try an earlier month in the reporting month control as well.
Check
Demo Sales Company shows its figures in SGD. Demo Group shows the consolidated figures in USD.
4Open the consolidated profit and loss
- With Demo Group selected, open Reports → Profit & Loss.
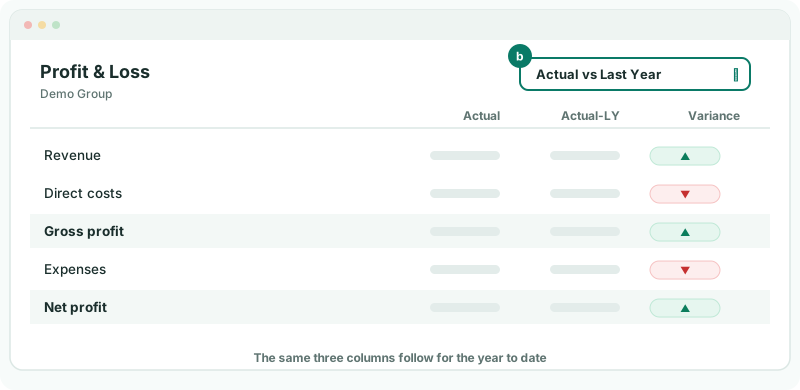
- Use the period selector at the top of the report to choose Actual vs Last Year.
Because the demo holds 24 months of history, the report shows the month as Actual, the same month last year as Actual-LY, and the Variance between them — then the same three columns for the year to date. The same selector offers Actual vs Budget and Actual vs Forecast.
5See where a group figure comes from
- In the Profit & Loss, click the amount on one of the revenue accounts.
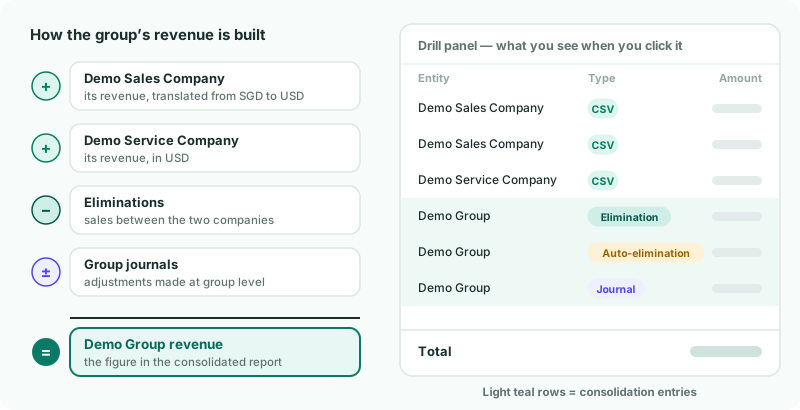
A drill panel opens under the row and lists every posting behind that figure. Each row names the company it came from, and a coloured badge shows its type:
| CSV | A company’s own figures. The demo companies are loaded the same way an Excel or CSV upload would load them. |
|---|---|
| Elimination / Auto-elimination | Entries that remove transactions between the group’s own companies. |
| Journal | Group-level adjustments posted on top of the companies’ books. |
Elimination and journal rows have a light teal background, so you can tell consolidation entries from company figures at a glance. The total at the bottom adds up the rows listed.
6Open an insight package
- Open Insight Packages in the left-hand menu.
- Open Monthly Pack, then Board Pack Example.
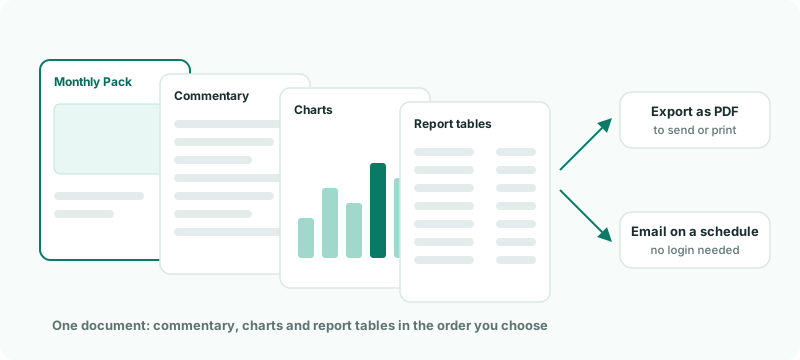
An insight package turns your numbers into a document you can send — commentary, charts and report tables in one place. You can export it as a PDF or have it emailed on a schedule, and the people receiving it do not need a BrizoConsol login.
7Reset the demo, or remove it
Click the DEMO badge in the header to open Manage Demo:
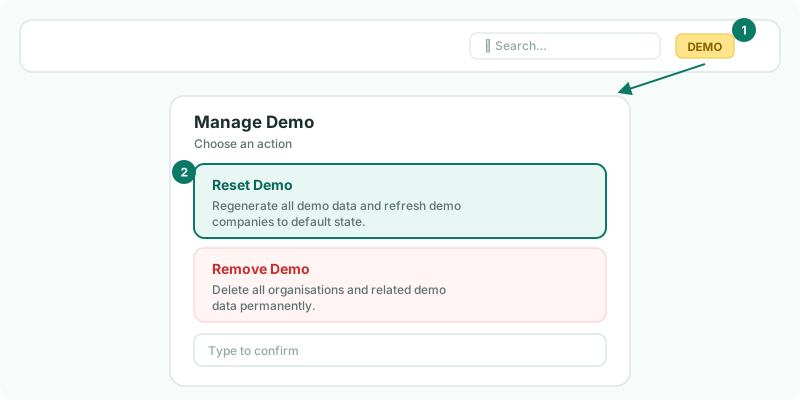
| Reset Demo | Rebuilds the demo as it was at the start. Use it after you have experimented. Type reset demo and click Confirm Reset. |
|---|---|
| Remove Demo | Deletes the demo companies and their data for good, and turns the demo group into your own empty group. Type remove demo, enter your group’s name in New top company name, and click Confirm Remove. Use it when you are ready to set up your own group — the next tutorial starts from there. |
Remove Demo cannot be undone. Once you add a real company, the demo can no longer be reset or removed from this menu.
Want more detail? See the documentation