
Read and Customise Reports · Track 4 · Tutorial 2 of 2
Report by division or project in a row/column report
How a division is reported depends on how it is kept. A division that is a company of its own is reported with a virtual group. A division tagged on transactions inside a company — a Xero tracking category, a QuickBooks class, a MYOB job, a Zoho reporting tag — is reported from that tag’s dataset.
1Choose the approach
| How the division is kept | Report it with |
|---|---|
| As a company of its own | A virtual group of those companies — see Report a subgroup with a virtual group. |
| As a tag on transactions | The tag’s dataset in a row/column report — this tutorial. The same dataset can also go in a Cell Report, by binding cells to Operational data (see Know when to use a Cell Report), or in a dashboard (see Show operational data in dashboards and Insight Packages). |
Each accounting system’s tags arrive as an operational dataset of profit and loss by tag:
| System | Dataset | Set up in |
|---|---|---|
| Xero | Xero Tracking: and the category’s name, such as Xero Tracking: Division | Bring in tracking categories |
| QuickBooks | QuickBooks: Class | Bring in classes |
| MYOB | MYOB: Job and MYOB: Category | Bring in jobs and categories |
| Zoho Books | Zoho Tag: and the tag’s name | Bring in reporting tags |
2Create the report
- Select Company A, open Reports → Custom Reports, and click Add a new report.
- Choose Row/column report.
- Name it Revenue by Division, and choose the Period and the Data Type Movement.
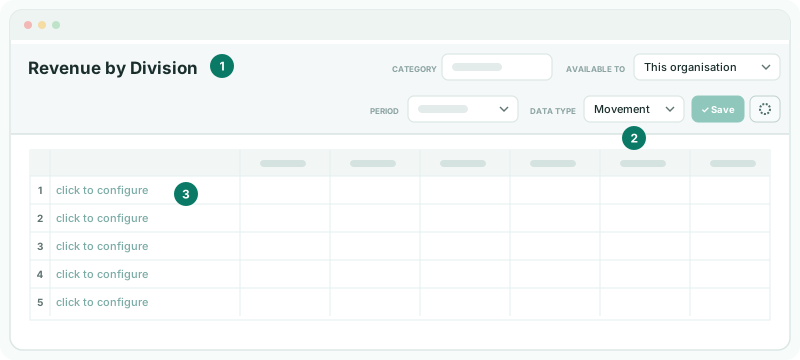
3Add the division rows
- Click the first blank row — click to configure — and choose Operational Data.
- In Operational Data, choose Xero Tracking: Division.
- If a Breakdown is offered, choose Tracking Option. In P&L Line, choose the line to show, such as the income total. The lines are the ones in Xero’s own report.
- Under Include Tracking Option, tick Retail, Wholesale and Online, and click Add Row.
- Click Save, then View.
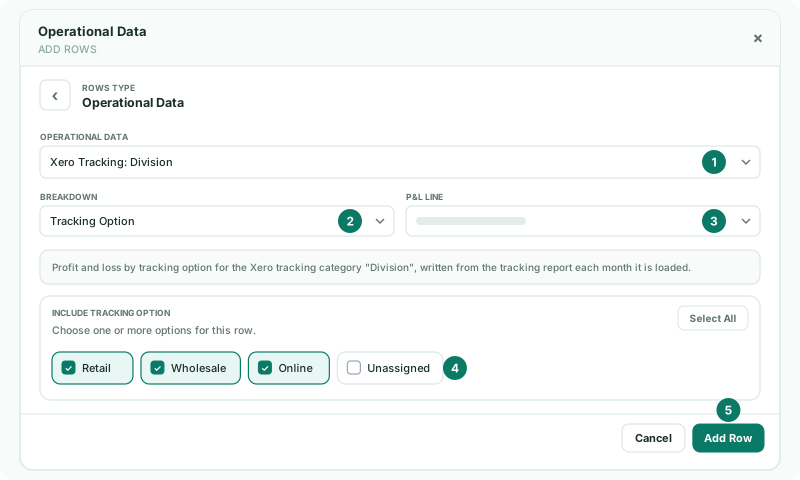
The row shows a heading with the dataset’s name, then one row for each option ticked, in every period column. Add more Operational Data rows for other lines, such as cost of sales, and a Formula row for a margin between them. On a group, Include Entities lists the companies that hold the dataset; untick one to leave it out.
4Check the figures
Check
Each division’s figure for a month equals the same tracking option in Xero’s profit and loss by tracking category for that month. On the setup page, View P&L by Tracking Category reads Xero live to compare.
Lines without a division are kept as Unassigned in the dataset, so tick it too when the divisions must add up to the company’s total.
5If something goes wrong
| Operational Data isn’t offered as a row type | No operational dataset is available for the entity. Bring the tags in first, as in the table in step 1. |
| A month is empty | That month’s profit and loss by tag isn’t loaded. Load it on Data Loading. |
| The divisions don’t add up to the company’s revenue | Unassigned isn’t ticked, or the line chosen in P&L Line isn’t the company’s revenue total. |
| Select at least one Tracking Option to continue. | Tick at least one option under Include Tracking Option. |
Want more detail? See the documentation