
Operational Data · Track 2 · Tutorial 7 of 8
Show operational data in dashboards and Insight Packages
Dashboards are where most people will see the operational data: a chart of units by product, a table of headcount by department. And an operational report can go straight into the month-end pack.
1Chart it
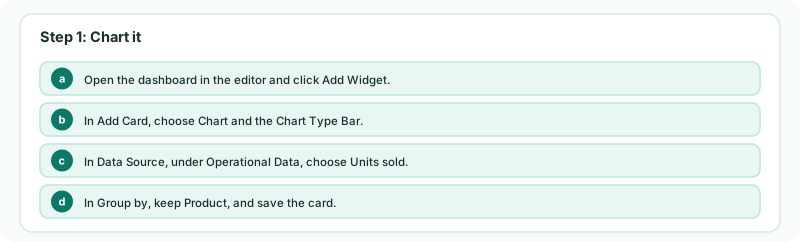
- Open the dashboard in the editor and click Add Widget.
- In Add Card, choose Chart and the Chart Type Bar.
- In Data Source, under Operational Data, choose Units sold.
- In Group by, keep Product, and save the card.
Group by offers the dataset’s dimensions, and Account if its rows have one; it appears when there is more than one to choose from. A dataset with a Scenario column also offers Scenario. At group level, matching datasets from several companies are one source.
2Tabulate it
- Click Add Widget again and choose Table.
- In Table Type, under Operational Data, choose Units sold, and choose a Data Type, such as YTD.
The table lists each product with Value and Share %; Records and Avg Value can be added under Columns. vs Budget and vs Forecast vs Budget are offered when the dataset holds those scenarios.
Check
The chart has a bar for each product, and the table’s values match the dataset page for the same months.
3Put it in an Insight Package
- Open the Units sold operational report from Reports, and arrange it as the pack needs it.
- Click Add to Insight Package, choose the package under Select Package, and click Add.
The report is added as it stands, with its layout, filters and months, as a section on a new page titled with the dataset’s name. Pulse does not read operational data.
4If something goes wrong
| What you see | What to do |
|---|---|
| The dataset is not under Operational Data | It has no rows for this company yet. Upload its data. |
| That section is already in this package. | The package already has this report from the same company. Open the package to see it. |
Want more detail? See the documentation