
Read and Customise Reports · Track 1 · Tutorial 2 of 5
Use the report toolbar, search and filters
Every report in BrizoConsol has the same toolbar. Some controls change what you see, some change how it looks, and a few send the report somewhere else. Knowing which is which keeps you from reading a filtered view as if it were the whole statement.
1Know the three kinds of control
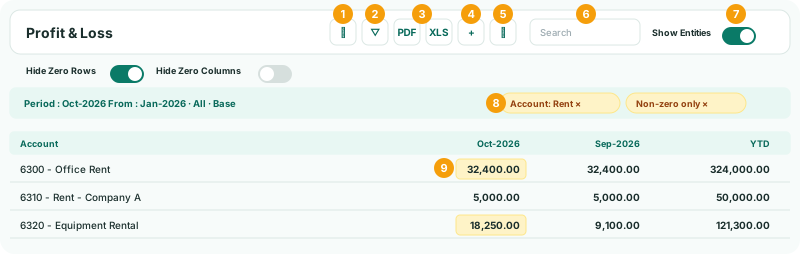
| Kind | Controls | What it does to the figures |
|---|---|---|
| Changes which rows you see | Search, Filter, Hide Zero Rows, Hide Zero Columns | Nothing. The figures are the same; some rows or columns are hidden. |
| Changes what is in the figures | The period, the scenario and currency in the selection, and All, Exclude Eliminations or Eliminations Only | The figures themselves. See Show entities, eliminations and adjustments side by side. |
| Changes how they look, or where they go | Report Settings, Export to PDF, Export to Excel, Add to Insight Package | Nothing. Number format, layout and destination only. |
The line under the toolbar always says what you are looking at: the Period, From and To for a custom range, and the elimination scope. Read it before you read a figure.
2Search for rows
- Open Reports → Profit & Loss for Your Group, Oct-2026.
- Type rent in Search.
Only rows whose text contains “rent” stay on screen: 6300 Office Rent, 6310 Rent - Company A, 6320 Equipment Rental. Capitals don’t matter. The search is shown above the report; click its × to remove it.
Search hides the totals too. Gross profit, operating expenses and the other total rows don’t contain your text, so they disappear. Use Search to find a line, not to read a subtotal.
3Filter or highlight by value
- Remove the search, and click Filter. Advanced filters opens.
- Under Result mode, choose Highlight cells.
- In Account name or code, enter Rent.
- Under Number filtering, turn on Enable amount filter, choose the Oct-2026 column, Greater than, and 10,000.
- Click Apply filters.
Every row stays, and the October rent cells over 10,000 are highlighted: Office Rent at 32,400 and Equipment Rental at 18,250. Each filter shows as a chip above the report; click a chip’s × to drop that filter alone.
- Open Filter again, switch Result mode to Filter rows, and apply.
Now only the matching accounts are listed. Total and heading rows still show, and they still carry the full totals: a filter hides accounts, it never changes what a total adds up.
| Filter | Keeps or highlights |
|---|---|
| Account name or code | Accounts whose name or code contains the text, such as Rent or G-51. |
| Non-zero values only, Negative values only | Accounts with a figure, or with a negative one in any column. |
| Account type | Accounts of the types you pick. |
| Number filtering | Values greater than, less than or between amounts, in one column or Any visible column. |
| Actual vs Forecast variance | Only on reports with actual and forecast columns: variances larger than the percentage you enter, for the period you choose. |
The filters combine: an account has to meet all of them. Clear all resets the drawer.
4Hide what is empty
Hide Zero Rows drops accounts with nothing in any column; Hide Zero Columns drops periods or companies with nothing in them. Neither changes a total. Turn Hide Zero Rows on for a report you send, and off when you check that an account is really empty rather than missing.
5Set how numbers look
- Click Report Settings.
- Set Number of Decimal to 0 for a board report, and Percentage Decimal to 1.
- Turn on Use Brackets When Negative, and choose whether to Show Account Code.
- Click Close.
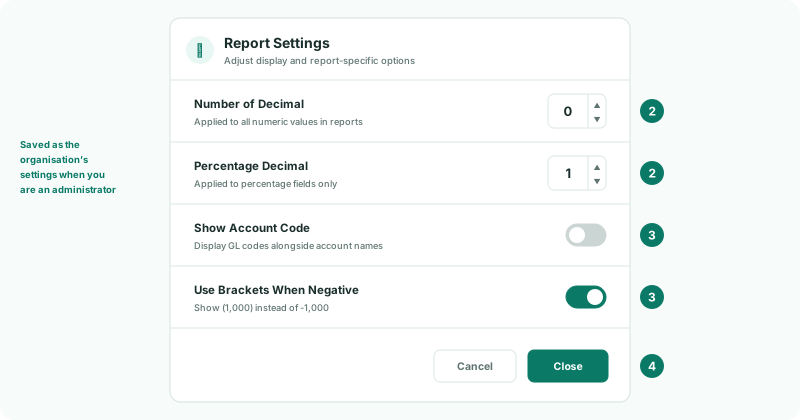
The settings start from your organisation’s reporting preferences. If you are an administrator of the organisation, the decimal places, account code and bracket settings you choose are saved back to those preferences, so they apply to every report and every user of that organisation.
6Send the report on
| Export to PDF, Export to Excel | A copy of the report to keep or send. |
|---|---|
| Add to Insight Package | Puts the report in a pack, to be published and sent with others. See Send the monthly pack. |
| Override Report, Edit | Change a built-in report for the whole subscription, or edit a report of your own. See the Customise the statements track. |
Check
With Filter rows on, the October Profit & Loss lists 6300 Office Rent and 6320 Equipment Rental, the chips above the report say why, and the expense totals are the same as with no filter.
7If something goes wrong
| A total looks wrong after filtering | It isn’t: totals always include every account. Remove the filters to see what makes them up. |
|---|---|
| The report seems to be missing lines | A search or filter is still on. Check the chips above the report, and Hide Zero Rows. |
| Actual vs Forecast variance isn’t in the drawer | The report has no actual and forecast columns side by side. |
| Apply filters can’t be clicked | The amount filter is on with no amount, or Between with no maximum. Enter it. |
| Show Entities isn’t on the toolbar | The report is a budget or forecast. Show Entities is on actual reports. |
Want more detail? See the documentation