
Read and Customise Reports · Track 1 · Tutorial 3 of 5
Drill from any figure to its source
Every figure on a report can be clicked. The drill panel lists the postings that make it up, whichever company, elimination or journal wrote them. What the panel shows changes with the figure: a month’s movement, a closing balance, a year to date, or a formula.
1Read the drill panel
- Select Your Group, and open Reports → Profit & Loss for Oct-2026.
- Click the October amount on the Sales row.
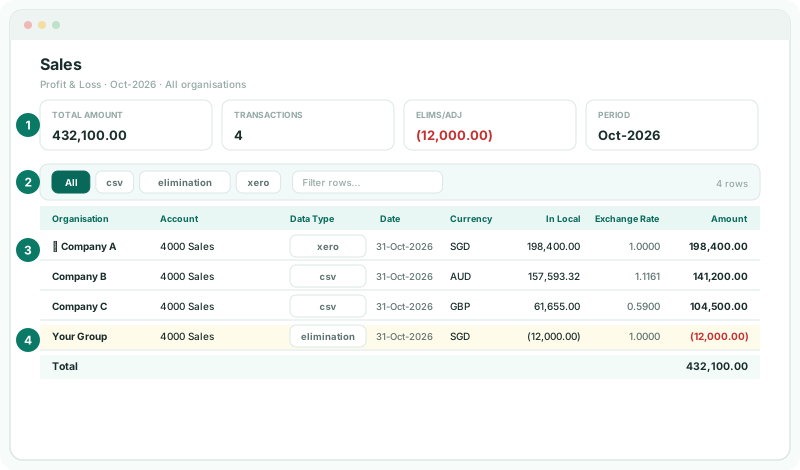
The line under the title names the report, the period and All organisations. The four cards summarise what follows:
| The amount | The figure you clicked, labelled by what it is: Total Amount on the profit and loss, Closing Balance for a balance sheet line, Month movement for a movement, YTD Amount for a year to date, or the formula’s own name. |
|---|---|
| Transactions | How many rows the panel lists. |
| Elims/Adj | The part that is eliminations and journals: the group’s own entries, not the companies’. |
| Period | The month, or YTD and the month. |
Each row has the Organisation, Account, Data Type, Standard, Date, Currency, In Local, Exchange Rate and Amount. In Local is the company’s own currency; Amount is the group’s. The rows add up to the figure you clicked.
Opened from a budget or forecast column, the panel also shows that scenario, so a budget figure is never read as an actual.
2Filter and sort the rows
- Click a data type above the table — one button for each type the rows contain, such as elimination, journal, csv or the accounting system a company loads from. All shows every row again.
- Type in Filter rows... to keep only rows containing the text, such as a company’s name.
- Click a column heading to sort by it.
The count on the right shows how many rows are left. Filtering changes the list, not the cards.
| To answer | Filter on |
|---|---|
| What did the group remove? | elimination and auto-elimination. |
| What did someone post by hand? | journal. |
| What came from a file? | csv. |
| What does one company contribute? | Its name in Filter rows. |
3Drill a balance sheet line
- Open Reports → Balance Sheet for Oct-2026, and click the amount on a receivables line.
- Click a company’s row with a ▸ caret to open its source postings.
The amount card reads Closing Balance, and the total row says the same. A company’s source postings start from its Opening balance and add the Month movement, so you see both what it was and what changed it. The table lists each posting’s Date, Source, Document, Part, Basis and Amount, with Tax and Document value when the documents carry them.
Postings that cancel each other, such as an invoice and the payment that settles it in the same month, are hidden. Click Show N postings that offset each other to see them, and Hide the postings that offset each other to put them away.
4Drill a year-to-date figure
- On Profit & Loss, choose a year-to-date period, and click Sales again.
The amount card reads YTD Amount and the period YTD with the month. A company’s source postings show the YTD movement instead of the month’s, so a year-to-date figure is traced over every month of the year, not only the last.
5Drill a formula row
- On Profit & Loss, click the October amount on GROSS PROFIT.
- Under Formula Breakdown, click a component to show only its lines. Click it again — Show every component — to see them all.
The amount card takes the formula’s name, the second card counts Rows and the third Components. The breakdown writes the formula out with its values — REVENUE − DIRECT COSTS = the figure — and the total row is Component Total. The same works on your own reports’ formula rows, such as a margin.
6Check and keep what you found
Check
The rows add up to the amount card: for October’s Sales, 198,400.00 + 141,200.00 + 104,500.00 − 12,000.00 = 432,100.00, with Elims/Adj showing the (12,000.00). Each company’s In Local divided by its Exchange Rate gives its Amount.
Use Export to PDF or Export to Excel at the top of the panel to keep the drill for the audit file. Clicking a document number opens the document itself, as in Trace any figure back to the invoice.
7If something goes wrong
| The rows don’t add up to the figure | A filter or the Filter rows box is on. Click All and clear the box. |
| No ▸ caret on a company’s row | Its documents aren’t loaded, or it was uploaded from a file, which holds balances, not documents. |
| An elimination row you didn’t expect | Click it to open the elimination behind it, and check the rule or entry that made it. |
| The panel shows a budget figure | The figure was clicked in a budget or forecast column. Click the actual column instead. |
Want more detail? See the documentation