
Foundations · Track 4 · Tutorial 4 of 5
Set up dashboards and KPIs
A dashboard puts the handful of numbers your board watches on one screen. Add the measure you are missing as a custom KPI, then build the dashboard once — it updates with every month you load.
1Decide what the board should see
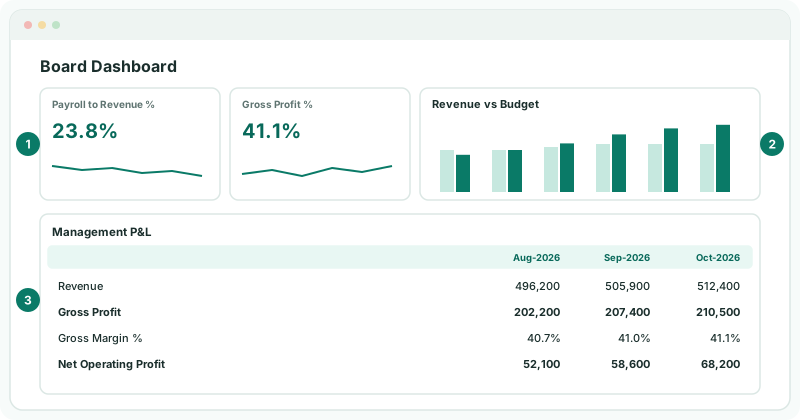
In the running example the board wants four things each month: how much of revenue goes on payroll, the gross margin, revenue against budget, and the Management P&L from Build the reports you need.
| KPI | A formula that turns the ledger into one number — a margin, a ratio, a per-day figure. Many come built in, such as Gross Profit %; you add the ones you are missing. |
|---|---|
| Dashboard | A page of cards. Each card is a KPI, a chart, a table, one of your reports, or text. |
Payroll to Revenue % is not built in, so the running example creates it first.
2Create the KPI
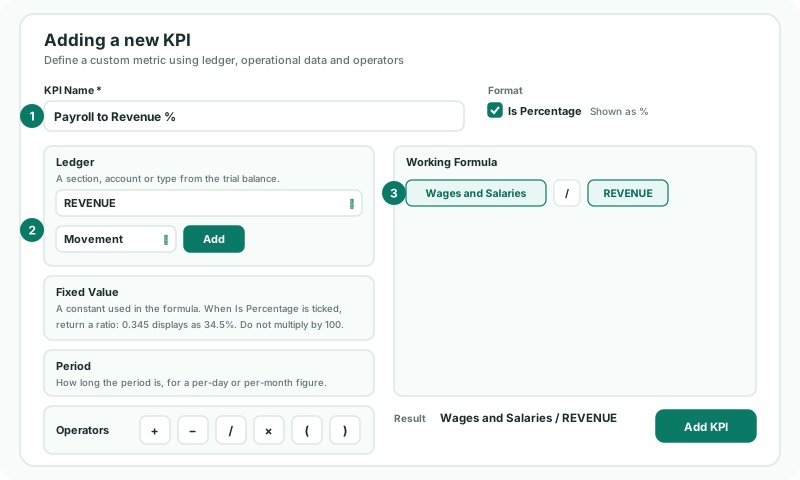
- Open Settings → Global Settings → Custom KPI, and click Add a new KPI.
- Type Payroll to Revenue % as the KPI Name, and tick Is Percentage.
- Under Ledger, choose the wages account, leave Movement, and click Add.
- Click the / operator.
- Under Ledger, choose REVENUE, Movement, and click Add.
- Check the Result, and click Add KPI.
| Movement or Balance | Movement is the period’s activity — right for profit and loss lines. Balance is the closing balance — right for balance sheet lines such as receivables. |
|---|---|
| Is Percentage | Build a ratio and let the format do the rest: 0.238 shows as 23.8%. Do not multiply by 100. |
| Period | Use Add days in period or Add months elapsed for per-day or per-month measures, such as debtor days. |
3Start the dashboard
- Open Dashboards → Custom, and click Add a new dashboard.
- Type Board Dashboard in the name box.
To start from a ready-made layout instead, use Template Start; to adapt one you already have, Duplicate Existing.
4Add the cards
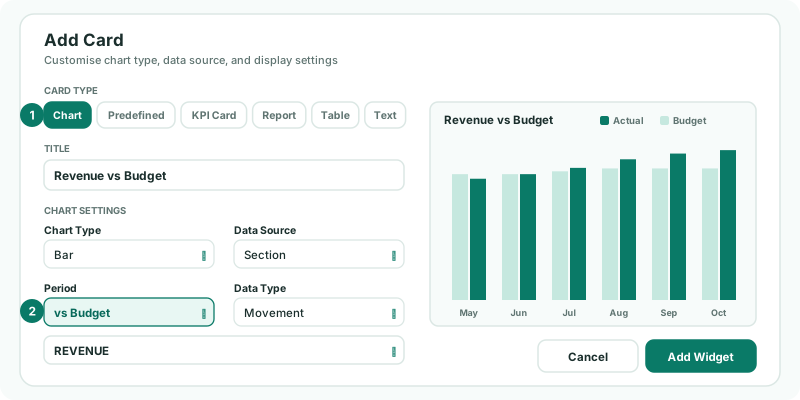
Click Add a widget for each card, choose its Card Type, set it up, and click Add Widget.
| KPI Card | Section / KPI: Payroll to Revenue %. Display: Number with line chart, to show the trend under the number. Add a second one for Gross Profit %. |
|---|---|
| Chart | Title Revenue vs Budget, Chart Type Bar, Data Source Section and REVENUE, Period vs Budget, Data Type Movement. |
| Report | Type: Custom report. Report: Management P&L. |
Drag a card to move it, and drag its corner to resize it. Each card keeps its own period, so a six-month trend can sit beside this month’s numbers.
5Save and check
- Click Save.
- Open the dashboard from Dashboards → Custom.
Check
Work out Payroll to Revenue % for October from the standard Profit & Loss — wages divided by revenue. It should match the card.
To get it to the board each month, schedule it, or add it to the monthly pack — see Send the monthly pack.
6If something does not look right
| What you see | What to do |
|---|---|
| The KPI shows 2,380% | The formula multiplies by 100 and Is Percentage is ticked. Remove the × 100. |
| A ratio of a balance sheet line looks wrong | Check each ledger part is read as Balance, not Movement. |
| An error under Working Formula when you click Add KPI | The formula is not complete — for example it ends in an operator, or a bracket is not closed. A name already used by another KPI is refused too. |
| A Report card says no reports are available | Create the custom report first, then add it as a card. |
| The chart shows no budget | The budget is not loaded for these months, or not at this level — see Compare actuals with budget and forecast. |
Want more detail? See the documentation