
Foundations · Track 4 · Tutorial 3 of 5
Build the reports you need
The standard statements answer the standard questions. When your management team asks for a different view — gross margin by month, a short P&L for the board — build it once as a custom report, and it updates every month on its own.
1Choose the kind of report
In the running example the board wants a one-page Management P&L: revenue, direct costs, gross profit, gross margin %, operating expense and operating profit, for the last three months.
| Row/column report | Built row by row; the columns come from the period you choose. Best for structured financial reports like this one — the running example. |
|---|---|
| Cell-based report | A spreadsheet where every cell can be text, a formula or live data. For layouts the rows and columns cannot give you. Free, Pro and Premium editions — see Cell Report. |
| BrizoBuilder | Describe the report in plain words and get an editable cell-based draft. |
2Create the report
- Open Reports → Custom Reports, and click Add a new report.
- Choose Row/column report. The editor opens.
- Type the name, Management P&L, in the name box.
- Set Period to Last 3 Months and Data Type to Movement — the right type for a profit and loss.
To start from a report you already have instead — the standard Profit & Loss, say — click Duplicate Existing and change the copy.
3Add the section rows
- In the preview, click click to configure on row 1. The Add Rows dialog opens.
- Choose Section, pick the REVENUE section, set Section display to Total only, and set the Row label to Revenue.
- Click Add Row.
- Do the same on row 2 for DIRECT COSTS.
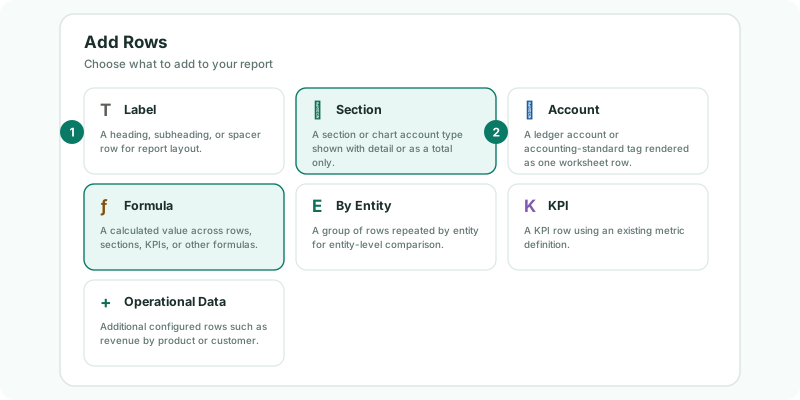
A section follows your chart of accounts, so a new revenue account mapped next year is included without touching the report. Choose Show detail instead of Total only to list the section’s accounts as well.
4Add the calculated rows
- On row 3, choose Formula and Custom Formula. Type Gross Profit as the Description.
- From Add Row, choose Revenue; click the − operator; choose Direct Costs. Click Add Row.
- On row 4, build Gross Margin % the same way: Gross Profit / Revenue.
- Click row 4 to edit it, tick Percentage under Format, and click Update Row.
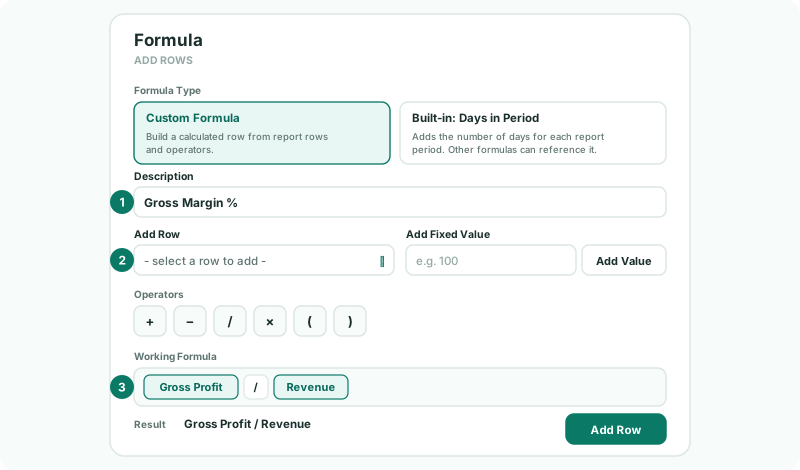
Do not multiply by 100: a Percentage row shows 0.411 as 41.1%. A formula can only pick rows that are already in the report, so add the rows it needs first. Finish with a Section row for OPERATING EXPENSE and a formula row for Net Operating Profit = Gross Profit − Operating Expense.
5Share it and save
- Set Category to Performance, so the report sits with similar ones in the library.
- Set Available to to This subscription, so every organisation in the subscription can open it. This organisation keeps it to the one you are in.
- Click Save.
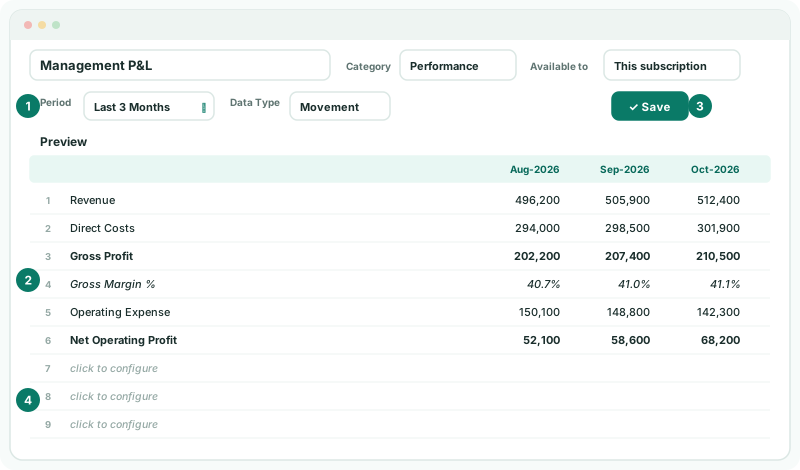
Check
The preview’s Revenue and Gross Profit for Oct-2026 match the standard Profit & Loss for the same month. If they do not, a section row is pointing at the wrong section.
6Use it every month
The report is now in Reports → Custom Reports. It reads each new month as it loads, so there is nothing to update.
| Pin it | Click the star on the report to keep it in the left navigation. |
|---|---|
| Change the view | Use the period selector when you open it — Actual vs Budget, Last 12 Months or any other — without editing the report. |
| Send it | Schedule it, or add it to the monthly pack, as in Send the monthly pack. |
| Same columns everywhere | For a column layout you use on many reports, save it once as a column set. |
7If something does not look right
| What you see | What to do |
|---|---|
| Save is greyed out | The report has no rows yet. Add at least one. |
| A formula row is empty or wrong | Check the Result line in the formula: it must name the rows you meant. |
| Gross Margin % shows 4,110% | The formula multiplies by 100 and the row is set to Percentage. Remove the × 100. |
| Profit and loss rows show balances, not each month’s figures | Set Data Type to Movement. Balance is for balance sheet reports. |
| Cell-based report shows Unavailable for this plan | Cell-based reports and BrizoBuilder are on the Free, Pro and Premium editions. Row/column reports are on all editions. |
Want more detail? See the documentation