
Foundations · Track 4 · Tutorial 1 of 5
Compare actuals with budget and forecast
A month’s numbers mean more next to what you expected. Load the budget once, keep the forecast up to date, and every report can show actual, plan and the variance side by side.
1Understand budget and forecast
In the running example the reporting month is October 2026. The group agreed a budget for 2026 last December, and updates its forecast each quarter.
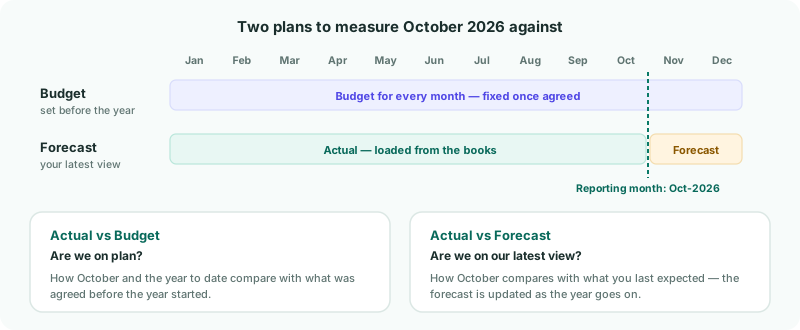
| Budget | A figure for every month of the budget year. You enter it once and leave it: it is what the year is measured against. |
|---|---|
| Forecast | Your latest view of the year. Months up to the reporting month show the actuals; the months after it show what you expect, and you update them as the year goes on. |
2Choose where budgets are entered
- Select your group, and open Settings → Organisation Settings → Organisation Details.
- In the Budget & Forecast Input row, click the edit icon and choose the level.
| Entity level only | Each company enters its own budget. Best when each company owns its plan. |
|---|---|
| Consolidated level only | One budget for the group, in the Common Chart of Accounts. Best when the plan is made centrally — the running example uses this. |
| Entity and consolidated level | Both are allowed. |
Where a level is not allowed, the Import icon and the Input Mode switch are greyed out, and hovering over them says where to enter instead. The Budget Opening Balances row below sets where a budget year’s balance sheet starts from — Last actual YTD unless you budget the balance sheet as well.
3Load the budget
- In the left navigation, open Budget → Profit & Loss, and choose 2026.
- Click the Import icon, and click Download template.
- Fill in the template: one row per account, one column per month, each cell the month’s movement.
- Drag the file onto the upload area, and click Upload.
The template already lists your accounts, with the Account Code and Account Name columns the upload needs, so build the budget in it or paste into it from your own spreadsheet. CSV, XLSX and TXT files are accepted, one at a time. Do the same on Budget → Balance Sheet if you budget the balance sheet.
4Update the forecast
- Open Forecast → Profit & Loss.
- Turn on Input Mode.
- Type into the November and December cells. Each value is stored as that month’s movement for the account.
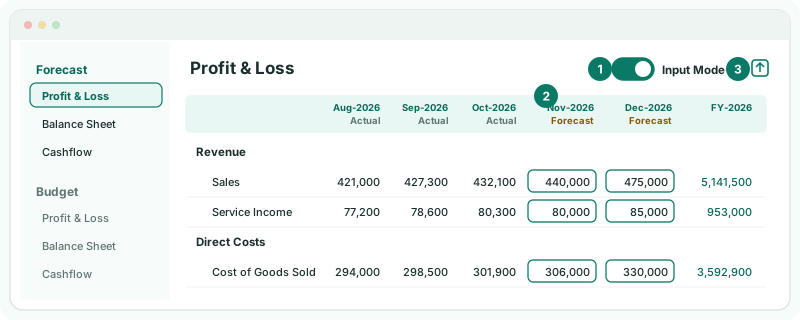
Months up to October are actuals and cannot be typed over. When the reporting month moves on to November, November becomes an actual column too — so the forecast is always actuals to date plus what is left. For a large update, use the Import icon as for the budget.
5Compare actual with budget
- Open Reports → All Reports, and under Performance open Profit & Loss Variance.
- Change the period selector to Actual vs Budget, and choose Oct-2026.
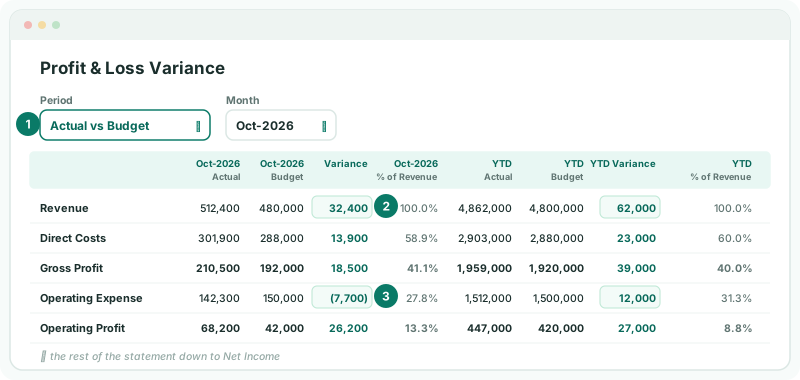
| Variance | Actual minus budget. Read it with the row: a positive variance is good on revenue and profit, and an overspend on a cost. |
|---|---|
| YTD | The same comparison from the start of the financial year to October. |
| % of Revenue | Each line as a share of revenue, to show margins next to the amounts. |
To compare with the forecast instead, choose Actual vs Forecast — or open Profit & Loss Forecast Variance, which starts there. The period selector works the same on any report, including the ones you build yourself.
6If something does not look right
| What you see | What to do |
|---|---|
| Actual vs Budget cannot be chosen | Budget and forecast are part of the Pro and Premium editions. |
| The Import icon and Input Mode are greyed out | The level you are on is not allowed by Budget & Forecast Input. Hover over them to see where to enter, or change the setting. |
| The budget column is empty | Check the budget was loaded for 2026, and at the level you are viewing: a budget entered for the group does not show on a company’s report. |
| The budget is in the wrong months | The template columns follow the year you chose on the Budget page. Download it again for the right year. |
| A variance has the wrong sign | Check the template amounts follow the same signs as the actuals in your reports. |
Want more detail? See the documentation