
SFRS Groups · Track 3 · Tutorial 1 of 4
Read the statement of financial position and profit or loss
Available on ProPremium
The SFRS statement of financial position and profit and loss show the same consolidated figures as the Base Balance Sheet and Profit & Loss, laid out the SFRS way. Most lines come from account sections; a few come from the classifications you set.
You will needSFRS switched on and every account classified, as in Switch on SFRS and classify equity and Classify profit or loss and cash flow lines.
By the endYour Group’s SFRS statement of financial position and profit and loss read line by line, and checked against the Base reports.
1Know where the lines come from
| From the account sections | Assets, liabilities, revenue, cost of sales, interest income, finance income and costs, and tax. Each line adds up the accounts in a section of the Common COA, such as Bank or Non-Current Liability. Nothing to classify. |
|---|---|
| From your classifications | Every equity line, Distribution Costs, Administrative Expenses and Share of Profit of Associates. Each reads the accounts you put on it on the Accounting Standard page. |
| Worked out | Subtotals, and the lines that are the rest of a section: Other Non-Current Assets, Other Income and Other Operating Expenses. |
The figures are the one consolidation, so the SFRS statements agree with the Base reports. Where they don’t, a classification is missing.
2Read the statement of financial position
- Select Your Group, and open Reports → All Reports → Consolidated Statement of Financial Position.
- Choose the month. The statement shows the balances at the end of it.
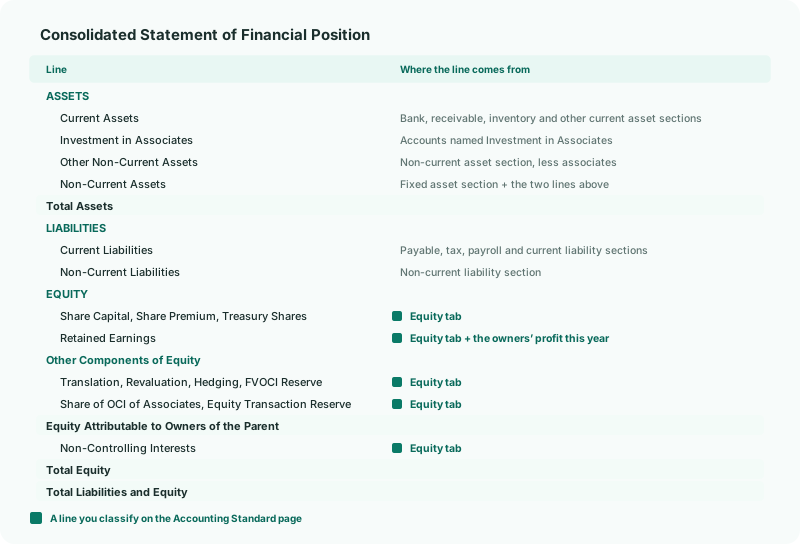
| Investment in Associates | The accounts named Investment in Associates or Investment in Joint Ventures, taken out of Other Non-Current Assets. See Account for associates and joint ventures. |
|---|---|
| Treasury Shares | The accounts on the Treasury Shares line — the company’s own shares it has bought back. They reduce equity, so they are shown as a deduction. |
| Retained Earnings | The accounts on the Retained Earnings line plus the year’s profit so far that belongs to the owners. The NCI’s share of the profit is in Non-Controlling Interests. |
| Other Components of Equity | The reserves, each from its line on the Equity tab: Translation Reserve, Revaluation Reserve, Hedging Reserve, FVOCI Reserve, Share of OCI of Associates and Equity Transaction Reserve. |
| Translation Reserve | The account on Cumulative Translation Adjustment — the owners’ share of the CTA. The NCI’s share is in Non-Controlling Interests. |
| Equity Transaction Reserve | Where the difference goes when the group buys or sells shares in a subsidiary it keeps control of. |
| Equity Attributable to Owners of the Parent | Every equity line above added together: the owners’ equity. |
| Non-Controlling Interests | The accounts on the Non-Controlling Interest line. Accounts created in Posting accounts are classified from their names, so NCI Net Assets, NCI Share of Profit, NCI Share of CTA and NCI Share of Other Reserves all land here. |
3Read the profit and loss
- Open Reports → All Reports → Consolidated Statement of Profit or Loss for 2026.
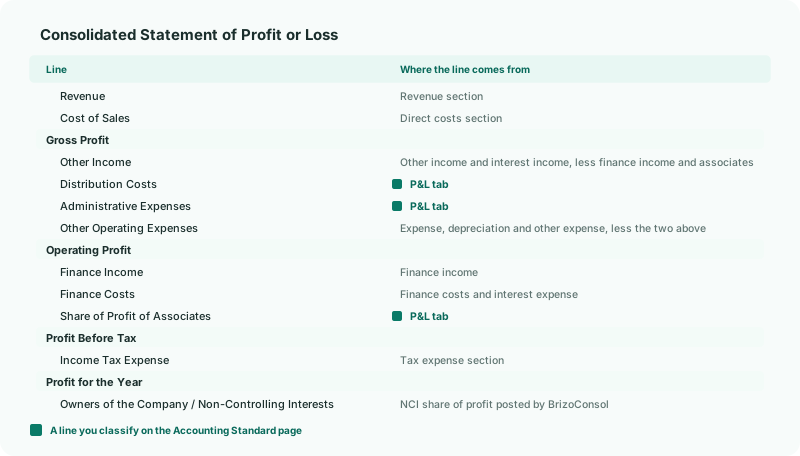
| Other Income | The other income section plus the interest income section, less finance income and the share of profit of associates, which have lines of their own. Interest income is part of operating profit here, not of Finance Income. |
|---|---|
| Other Operating Expenses | The expense, depreciation and other expense sections, less finance costs, Distribution Costs and Administrative Expenses. For Your Group: Distribution Costs 310,000 and Administrative Expenses 520,000. |
| Finance Income, Finance Costs | The finance income accounts; and the finance costs and interest expense sections. |
| Share of Profit of Associates | After finance costs, just above Profit Before Tax. |
| Owners of the Company, Non-Controlling Interests | The NCI’s share is the share of profit BrizoConsol posts for each subsidiary with an NCI; the owners’ share is the rest. |
4Check against the Base reports
- Open the group’s Balance Sheet and Profit & Loss for the same month and year.
Check
On the SFRS statement of financial position, Total Assets equals Total Liabilities and Equity, and Total Equity equals the Balance Sheet’s equity — 1,817,100 for Your Group. Profit for the Year on the SFRS profit and loss equals Net Profit on Profit & Loss.
5If something goes wrong
| Total Equity is lower than the Balance Sheet, and the statement doesn’t balance | An equity account isn’t classified. Put it on its line on the Equity tab — see Switch on SFRS and classify equity. |
| Other Operating Expenses is negative | An account on Distribution Costs or Administrative Expenses isn’t an expense. Take it off. |
| Investment in Associates is empty, but the group has an associate | The investment account’s name wasn’t recognised. Create it from Posting accounts on the Ownership page, named Investment in Associates. |
| The SFRS statements aren’t in All Reports | Select the group, not a company. SFRS must be enabled and saved for it. |
Want more detail? See the documentation