
Dashboards and KPIs · Track 4 · Tutorial 1 of 3
Read Key Metrics and the Health Score
Pulse is the page to open every day: each key metric for the month and the year, against its target, with a status. Knowing how each column and score is worked out tells you which signals to act on.
1Open Key Metrics
- Open Pulse → Key Metrics.
- Choose Oct-2026 in the month at the top of the page. Where the group reports in more than one currency, choose the currency beside it.
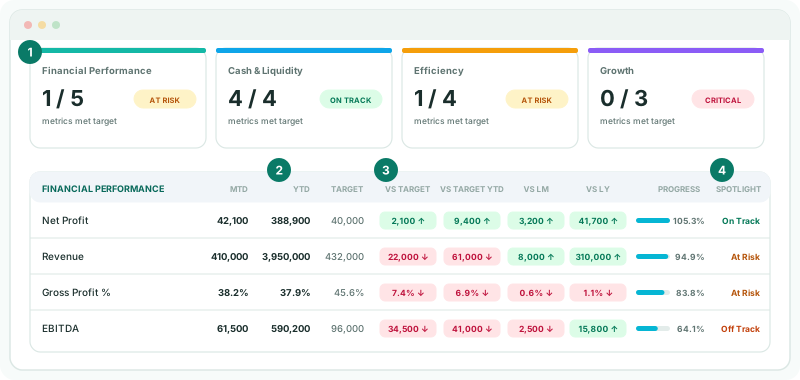
The page has a card for each section, then a table for each section with one row per KPI. Until an administrator changes them, the sections are Financial Performance, Cash & Liquidity, Efficiency and Growth.
2Read a row
| MTD | The KPI for the month chosen. |
|---|---|
| YTD | The KPI for the fiscal year to that month. |
| Target | The month’s target, by the method set for the KPI. Until an administrator changes it, a built-in KPI’s target is the same month last year plus 20%. |
| Vs Target | MTD less Target, with an arrow up when MTD is above the target and down when below. |
| Vs Target YTD | YTD less the year-to-date target. |
| Vs LM | MTD less last month. Point at it to see last month’s figure. |
| Progress | MTD as a percentage of Target. The bar fills at 100%. |
| Spotlight | On Track above 100%; At Risk from 80% to 100%; Off Track from 50% to 80%; Critical below 50%. A target of 0 gives 0% and Critical. |
Each section card counts the KPIs that are On Track, such as 3 / 5 metrics met target. It shows On Track when all are, Critical when none are, and At Risk otherwise. Click a card to jump to its table.
3Drill into a KPI
| The KPI name | A panel slides in with the KPI month by month, as a chart and a table. |
|---|---|
| MTD or YTD | Opens the KPI’s detail page for the month or the year. |
| Target, a variance, Progress or Spotlight | Opens the target page: it names the basis the target comes from, shows Target, Actual (MTD), vs Target, Progress and Spotlight, and charts the KPI against its target. |
4Read a Health Score
Pulse → Cashflow Analysis, Receivables and Payables each open with a Health Score out of 100, built from a few KPIs and their weights.
- Open Pulse → Cashflow Analysis for Oct-2026.
- Read Key KPIs - Vs Target: each KPI’s Value, its Vs Target, and its Score (pts).
| Score (pts) | The KPI’s Progress, capped at 100%, times its weight. With four KPIs at 25% each, a KPI above target scores 25 points; one at 60% of target scores 15. |
|---|---|
| Total KPI score | The points added up, out of 100. This is the Health Score. |
| Healthy | A score of 80 or more. |
| Watchlist | From 50 to 80. |
| Needs attention | Below 50. |
Each KPI is measured against the same target as on Key Metrics. The Relative bar only compares the size of the values in the panel. To choose the KPIs and weights, see Customise Pulse KPIs.
Check
On Key Metrics for Oct-2026, Revenue MTD equals October revenue on the Profit & Loss, and its Progress equals MTD divided by Target. On Cashflow Analysis, the Score (pts) column adds up to the Health Score.
5Share it
Click the Export to PDF icon for a PDF of the page. An Administrator or Dashboard Admin can click Add to Insight Package to put the page in a pack.
6If something goes wrong
| What you see | What to do |
|---|---|
| There is no pencil icon | Changing Pulse needs the Administrator or Dashboard Admin role. |
| There is no subscription associated with you. Please add a subscription to continue. | The group’s subscription has been cancelled. Renew it to use Pulse. |
| Target is 0 and Spotlight is Critical | The target’s basis has no figure, such as no forecast or no data last year. Change the KPI’s target method; see Define your own KPIs with targets. |
Want more detail? See the documentation