
Dashboards and KPIs · Track 4 · Tutorial 3 of 3
Customise Pulse KPIs
The KPIs a group manages by are its own. Pulse lets you choose them, group them the way your board reads them, and decide what each Health Score is made of.
1Arrange Key Metrics
- Open Pulse → Key Metrics with Your Group selected, and click the Edit icon (the pencil).
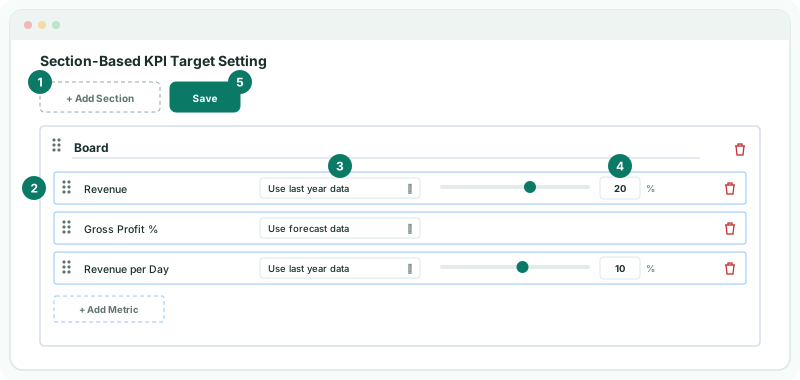
- To add a section, click Add Section, type a name such as Board, and click Add. To rename a section, type over its name.
- To add a KPI, click Add Metric in the section, search or click a category, choose the KPI, and click Add.
- Drag a KPI by its handle to reorder it or move it to another section; drag a section by its handle to reorder sections.
- To remove a KPI or a section, click its red delete icon and confirm with Delete Metric or Delete Section.
- Click Save.
Removing a section removes its KPIs from Key Metrics. Key Metrics holds each KPI once, and the layout is the same for everyone in the group.
2Set each target
Beside each KPI, choose how its target is set, and for Use last year data the percentage on the slider or in the box.
| Use forecast data | The KPI worked out on the forecast for the month. |
|---|---|
| Use last year data | The KPI for the same month last year, plus the percentage: 20 means 20% more. A built-in KPI starts here at 20%. |
For a worked example, see Define your own KPIs with targets.
3Choose the Health Score KPIs
- Open Pulse → Cashflow Analysis, Receivables or Payables, and click the Edit icon.
- On Health Score Calculator, click Add KPI, choose the KPI, and click Add. A new KPI starts at 0%.
- Type each KPI’s weight in its % box. Make the weights add up to 100.
- To remove a KPI, click its red delete icon and confirm with Delete KPI.
- Click Save.
| Page | KPIs until you save your own |
|---|---|
| Cashflow Analysis | Operating Cashflow, Cash Ratio, Cashflow Margin % and Cash Balance, 25% each. |
| Receivables | Receivables Days, Cash Conversion Cycle, Revenue Growth % and Net Profit %, 25% each. |
| Payables | Payables Days, Cash Conversion Cycle, Current Ratio and Operating Cashflow, 25% each. |
Each page keeps its own list. A KPI scores up to its weight, so weights that add up to less than 100 cap the score below 100. Each KPI is measured against the target set for it on Key Metrics.
Check
Back on the page, each KPI’s Score (pts) is its Progress, capped at 100%, times its weight, and Total KPI score is their sum.
4If something goes wrong
| What you see | What to do |
|---|---|
| There is no pencil icon | Changing Pulse needs the Administrator or Dashboard Admin role. |
| Section name cannot be empty | Type a name before clicking Add. |
| This KPI is already in use here. | The KPI is already on this page. On Key Metrics, drag it to the section you want. |
| No KPIs match the current filters. | Clear the search box or click All. |
| Your own KPI isn’t in the list | Open the editor with Your Group selected, where custom KPIs are defined. |
Want more detail? See the documentation