
Dashboards and KPIs · Track 3 · Tutorial 1 of 5
Use financial performance and growth KPIs
Margins and growth rates are the first numbers a board asks about. BrizoConsol works them out from the group’s ledger every month, the same way for every company, so you read them instead of rebuilding them in a spreadsheet.
1Add the KPIs to Pulse
- Open Pulse → Key Metrics with Your Group selected, and click the Edit icon (the pencil).
- Click Add Section, type Profitability, and click Add.
- In the new section, click Add Metric, then click Financial to list those KPIs. Click Growth for the growth KPIs.
- Click a KPI to read its description and formula, then click Add. Repeat for each KPI you want.
- Click Save.
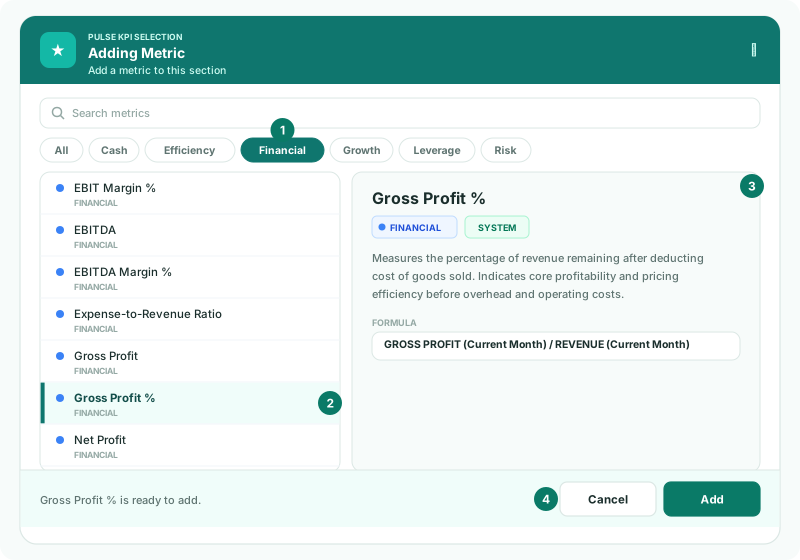
In the formula each part is an account section, such as REVENUE, with how it is read: (Current Month) is the movement of the period, (Current Balance) the closing balance, (Average) the average of the opening and closing balance, and (Last Month) the earlier period. The same KPIs are offered on a dashboard KPI card and as a report KPI row; see Set up dashboards and KPIs and Add KPI and operational data rows.
2Know the profit KPIs
| Revenue | REVENUE. The period’s sales. |
|---|---|
| Gross Profit | REVENUE − DIRECT COSTS. |
| Gross Profit % | GROSS PROFIT ÷ REVENUE. The share of each sale left after direct costs: how well pricing covers what the goods or service cost. |
| Operating Expenses | EXPENSE. The EXPENSE section only; depreciation, interest and tax are sections of their own. |
| Expense-to-Revenue Ratio | EXPENSE ÷ REVENUE, as a percentage. How much of each sale the running costs take. |
| Operating Profit | GROSS PROFIT − EXPENSE. |
| EBIT | GROSS PROFIT − EXPENSE − DEPRECIATION + OTHER INCOME − OTHER EXPENSE. Profit before interest and tax. |
| EBITDA | NET PROFIT + INTEREST EXPENSE − INTEREST INCOME + TAXES EXPENSE + DEPRECIATION. Profit before interest, tax and depreciation. |
| EBITDA Margin % | EBITDA ÷ REVENUE. |
| Net Profit | GROSS PROFIT − EXPENSE − DEPRECIATION − INTEREST EXPENSE + INTEREST INCOME + OTHER INCOME − OTHER EXPENSE − TAXES EXPENSE. The bottom line. |
| Net Profit % | NET PROFIT ÷ REVENUE. |
| Return on Assets | NET PROFIT × 12 ÷ months elapsed ÷ average total assets. Profit for a year at this rate, against the assets used to earn it. |
| Return on Equity | NET PROFIT ÷ EQUITY at the closing balance. Not annualised: MTD uses the month’s profit, YTD the profit for the year to date. |
3Know the growth KPIs
| Revenue Growth | REVENUE ÷ REVENUE of the earlier period − 1. Revenue Growth % has the same formula. |
|---|---|
| Net Profit Growth | NET PROFIT ÷ NET PROFIT of the earlier period − 1. |
| Expense Growth | EXPENSE ÷ EXPENSE of the earlier period − 1. |
The earlier period depends on the column. For MTD it is the month before: Oct-2026 against Sep-2026. For YTD it is the same months a year earlier: the year to Oct-2026 against the year to Oct-2025.
When the earlier figure is a loss, Net Profit Growth divides figures of opposite sign. Compare the two profits themselves instead.
4Read a month and the year to date
Every KPI is worked out twice on Key Metrics: MTD for the month chosen at the top of the page, and YTD for the fiscal year to that month. Each part of the formula is read like this:
| (Current Month) | MTD: the month’s movement. YTD: the movements from the start of the fiscal year to the month, added up. |
|---|---|
| (Current Balance) | The closing balance at the end of the month, for both MTD and YTD. |
| (Average) | MTD: the average of last month’s closing balance and this month’s. YTD: the average of the balance at the start of the fiscal year and this month’s closing balance. |
| Days in period | MTD: the days in the month. YTD: the days from the start of the fiscal year to the end of the month. |
| Months elapsed | MTD: 1. YTD: the months from the start of the fiscal year, such as 10 for October in a January year. |
So Return on Assets for Oct-2026 MTD is October’s profit × 12; YTD it is the profit for the year to October × 12 ÷ 10, in a January year. Both are rates for a full year.
Check
Open the Profit & Loss for Oct-2026. Gross profit divided by revenue for October equals Gross Profit % MTD; the same sum on the year-to-date figures equals YTD.
5If something goes wrong
| What you see | What to do |
|---|---|
| There is no pencil icon on Key Metrics | Changing Pulse needs the Administrator or Dashboard Admin role. Ask one to add the KPIs, or use a dashboard KPI card. |
| No KPIs match the current filters. | Clear the search box or click All. |
| This KPI is already in use here. | The KPI is already in another section. Key Metrics holds each KPI once; drag it to the section you want. |
Want more detail? See the documentation