
Dashboards and KPIs · Track 3 · Tutorial 2 of 5
Use efficiency KPIs
Efficiency KPIs show how long cash is tied up in customers, stock and suppliers, and how hard the assets work. They turn balance sheet positions into days and multiples you can compare month by month.
1Add the KPIs to Pulse
- Open Pulse → Key Metrics with Your Group selected, and click the Edit icon (the pencil).
- Click Add Section, type Working capital, and click Add.
- In the new section, click Add Metric, then click Efficiency to list those KPIs.
- Click a KPI to read its description and formula, then click Add. Repeat for each KPI you want.
- Click Save.
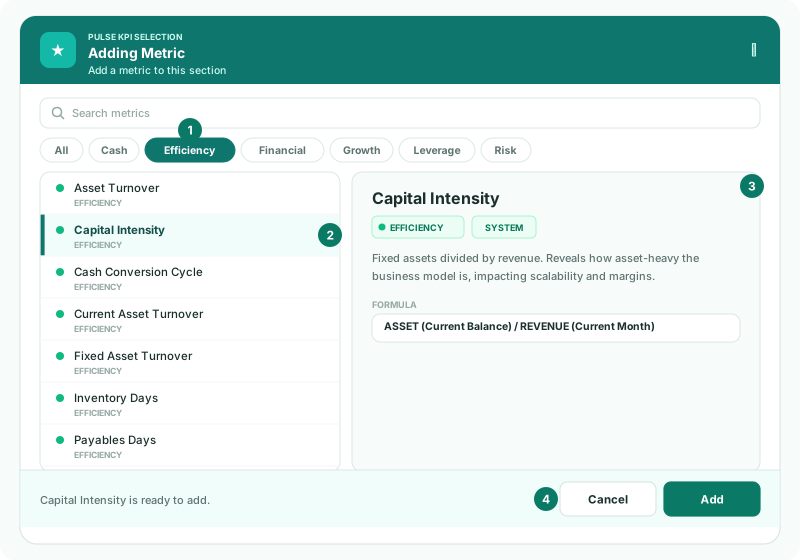
In the formula each part is an account section, such as REVENUE, with how it is read: (Current Month) is the movement of the period, (Current Balance) the closing balance, (Average) the average of the opening and closing balance, and (Last Month) the earlier period. The same KPIs are offered on a dashboard KPI card and as a report KPI row; see Set up dashboards and KPIs and Add KPI and operational data rows.
2Know the days KPIs
| Receivables Days | Average ACCOUNTS RECEIVABLE ÷ REVENUE × days in period. About how many days of sales customers still owe. |
|---|---|
| Inventory Days | Average INVENTORY ÷ DIRECT COSTS × days in period. About how many days of direct costs sit in stock. |
| Payables Days | Average ACCOUNTS PAYABLE ÷ DIRECT COSTS × days in period. About how many days of direct costs the group still owes suppliers. |
| Cash Conversion Cycle | Receivables Days + Inventory Days − Payables Days. The days between paying for costs and collecting the cash from sales. |
| Total Receivables | ACCOUNTS RECEIVABLE at the closing balance. |
The average is the opening plus the closing balance, divided by 2. For MTD the opening balance is last month’s closing balance and the days are the days in the month. For YTD the opening balance is the balance at the start of the fiscal year and the days are the days in the year to date.
3Know the turnover KPIs
| Asset Turnover | REVENUE × 12 ÷ months elapsed ÷ average total assets. |
|---|---|
| Fixed Asset Turnover | REVENUE × 12 ÷ months elapsed ÷ average FIXED ASSET. |
| Current Asset Turnover | REVENUE × 12 ÷ months elapsed ÷ average of BANK + ACCOUNTS RECEIVABLE + INVENTORY + CURRENT ASSET. |
Each one is revenue for a full year at this rate, against the assets that earn it. They show as percentages: 250% means annual revenue is 2.5 times the assets.
4Check a figure
Check
For Oct-2026, take Accounts Receivable at the end of September and of October from the Balance Sheet, average them, divide by October revenue and multiply by 31. The result equals Receivables Days MTD. On the same row, Cash Conversion Cycle equals Receivables Days + Inventory Days − Payables Days.
5If something goes wrong
| What you see | What to do |
|---|---|
| There is no pencil icon on Key Metrics | Changing Pulse needs the Administrator or Dashboard Admin role. Ask one to add the KPIs, or use a dashboard KPI card. |
| No KPIs match the current filters. | Clear the search box or click All. |
| This KPI is already in use here. | The KPI is already in another section. Key Metrics holds each KPI once; drag it to the section you want. |
Want more detail? See the documentation