
Row/Column Reports · Track 1 · Tutorial 7 of 7
Add KPI and operational data rows
A management report is more than the ledger. A KPI row shows a ratio already defined as a KPI, worked out for every column. An Operational Data row brings in figures kept outside the chart of accounts, such as revenue by product or headcount.
1Add a KPI row
- Open the Management P&L in the editor. Click the next blank row and choose KPI.
- Type EBITDA in Search KPIs…, or pick a category to narrow the list.
- Choose EBITDA Margin %. The panel below names it and shows its description and formula.
- Click Add Row, then Save.
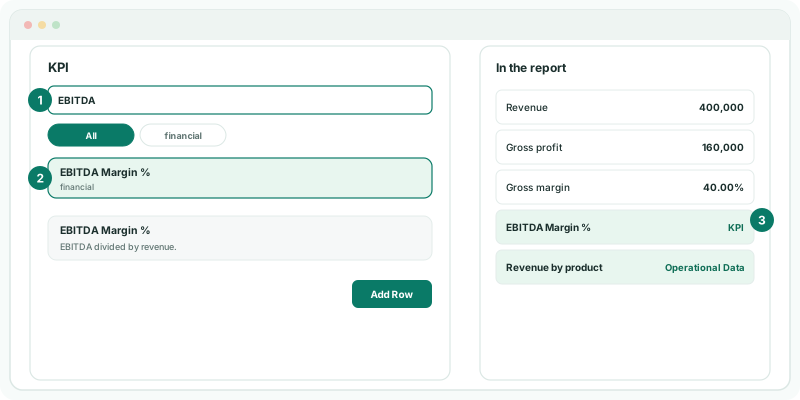
The row is named after the KPI and works it out the way the KPI is defined, for each column, as a percentage when the KPI is one. The list holds the built-in KPIs and any your group defined; see Built-in KPIs Overview. A KPI row is the way to reuse a ratio defined once; for a calculation used in this report only, a formula row is simpler.
2Add operational data rows
- Click the next blank row and choose Operational Data.
- In Operational Data, choose the dataset, such as a product dataset or an accounting system’s tracking categories.
- Choose what each row shows and tick the options to include, then click Add Row and Save.
The block shows a heading with the dataset’s name and one row for each option ticked, in every column. On a group, Include Entities lists the companies that hold the dataset; untick one to leave it out. For a worked example with Xero tracking categories, see Report by division or project in a row/column report.
3Check the result
- Click View.
Check
EBITDA Margin % for Oct-2026 is the same figure the KPI shows elsewhere for that month, such as on Pulse Key Metrics when it is one of your key metrics. The operational data rows match the dataset’s figures for the same month.
4If something goes wrong
| What you see | What to do |
|---|---|
| No KPIs found. | Clear the search or choose All. |
| Choose a KPI to continue. | Click a KPI in the list before Add Row. |
| Operational Data isn’t offered as a row type | No operational dataset is available for the organisation. Load one first. |
| Choose operational data to continue. | Choose a dataset in Operational Data. |
| Select at least one option for this row. | Tick at least one option to include. |
Want more detail? See the documentation