
Zoho Books Groups · Track 3 · Tutorial 2 of 3
Build department and store dashboards
Once a reporting tag is mapped to Department or Store, BrizoConsol offers a ready-built dashboard for it. Start from the template, check the figures, and add tag charts to your other dashboards.
1Know which template you get
Each template appears only when a reporting tag is mapped to its type. South’s Outlet tag is mapped to Store, and Department to Department, so both are offered.
| Store Performance | Total Store Revenue, Best Performing Store, Total Store Net Profit and Number of Stores; a Store Performance Table ranking stores by revenue; charts Revenue per Store, Net Profit by Store, Top Stores Trend and Revenue Distribution by Store. |
|---|---|
| Department P&L | Total Department Revenue, Total Department Expenses, Total Department Net Profit and Number of Departments; a Department Net Profit Table; charts Revenue by Department, Expense by Department, Net Profit by Department and Department Revenue Trend. |
The four figures at the top and the table cover the last 12 months. The bar charts show the last 6 months, month by month.
2Start from the template
- Select South Pte Ltd, and open Dashboards → Custom.
- Click Template Start.
- Choose Store Performance, and click Use This Template.
- The dashboard opens ready-built. Click Save.
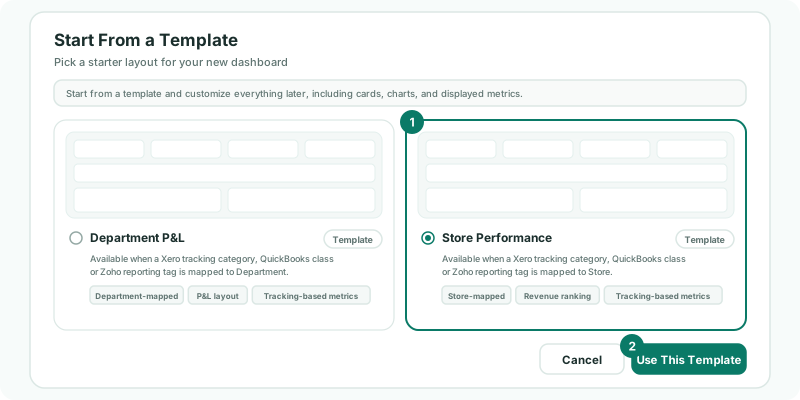
Repeat with Department P&L for a second dashboard.
3Read the dashboard
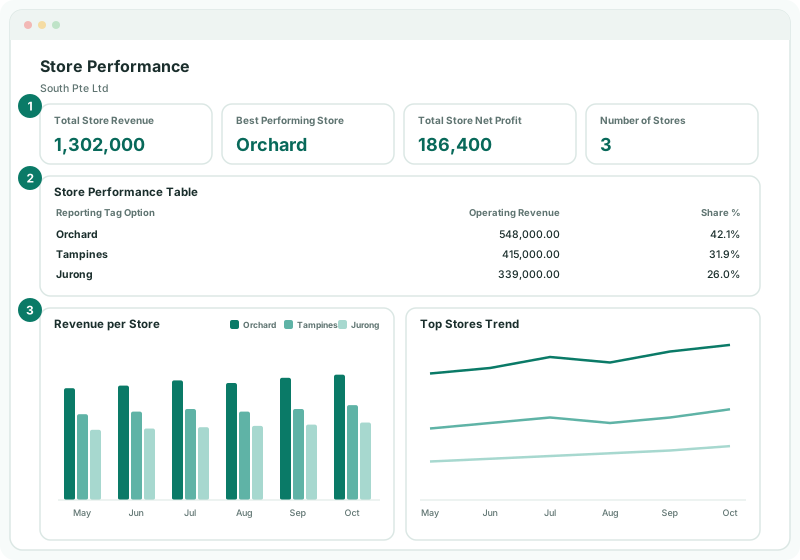
| Best Performing Store | The option with the most operating revenue over 12 months — Orchard. |
|---|---|
| Store Performance Table | Each option’s operating revenue and its share of the total, top 10 first. |
| Currency and basis | South’s own currency, on the accrual basis — the same figures as P&L by Reporting Tag. |
| Unallocated | Untagged amounts are included as an option of their own, so the dashboard adds up to the company. A big Unallocated slice means transactions are missing the tag in Zoho. |
Check
Best Performing Store is Orchard, and October’s bars match the option columns of October’s P&L by Reporting Tag for Outlet — Orchard 48,200, Tampines 36,500, Jurong 29,800.
4Add a tag chart to any dashboard
You don’t need a template for a single chart. On any dashboard you edit:
- Click Add a widget, and choose a chart.
- As the data source, choose Operating Revenue by Reporting Tag, Operating Expenses by Reporting Tag or Net Profit by Reporting Tag.
- Choose the Reporting Tag — Outlet or Department — and click Add Widget.
These sources work for every tag you imported, mapped or not. A chart shows the top 8 options by default.
5Keep it current
The dashboard reads the months you loaded. The nightly read keeps the last 6 months up to date; for a month older than that, or one you changed in Zoho, load P&L by Reporting Tag again on Data Loading. A new outlet appears on its own once it is used in Zoho and the month is loaded.
6If something goes wrong
| Store Performance isn’t offered | No active tag is mapped to Store. Map one on Reporting Tag Setup and save — see Bring in reporting tags. |
|---|---|
| The template is built on another company’s tag | It uses the selected company’s Store tag first, then the first other company in your group that has one. Select South before you click Template Start. |
| The cards are empty | No P&L by Reporting Tag is loaded for the last 12 months. Load the months on Data Loading. |
| A store is missing | It has no amounts in the loaded months, or the option was added in Zoho after the last load. Load the month again. |
Want more detail? See the documentation