
Zoho Books Groups · Track 3 · Tutorial 3 of 3
Combine tags across companies in different currencies
When two Zoho companies use the same reporting tag, the group can show them side by side. If the companies keep their books in different currencies, use the right source, or one company’s figures are counted as if they were the other’s currency.
1Know the two ways to read a tag on the group
South Pte Ltd (SGD) has three outlets: Orchard, Tampines and Jurong. East Sdn Bhd (MYR) has two: Mid Valley and Johor Bahru. Both tag their Zoho transactions Outlet. In October, Mid Valley sold MYR 62,000.
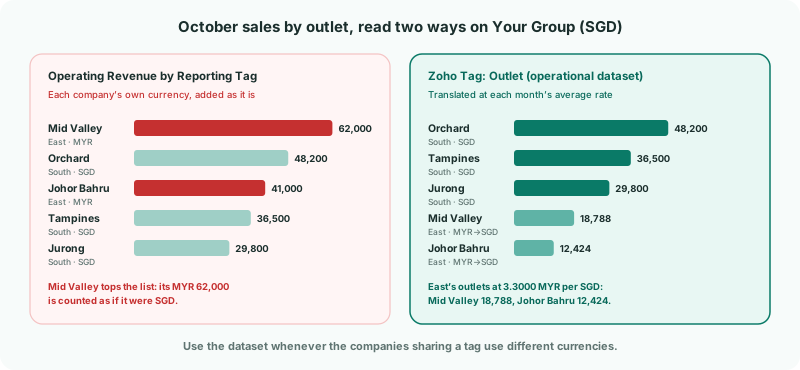
| … by Reporting Tag sources | Operating Revenue, Operating Expenses and Net Profit by Reporting Tag, and the Department P&L and Store Performance templates. On the group they add every company’s figures in that company’s own currency. Right when all the companies share a currency; wrong otherwise. |
|---|---|
| The Zoho Tag dataset | Zoho Tag: Outlet, written for each company from the same figures. On the group, each month is translated into the group currency at that month’s average rate before anything is added. |
2Name the tag the same in every company
The group reads South’s and East’s datasets as one source only when they have the same name. Both are named after the tag, so the tag must be called Outlet in both Zoho organisations — capitals don’t matter.
Inside the tag, figures fall on the same row only when the option names match exactly. That is why a shared option — say both companies had an outlet called Online — must be spelled the same in both.
Then bring in East’s tags and load its months the same way as South’s.
3Check the rates
- Select Your Group, and open Settings → Global Settings → Exchange Rates.
- Check that every month you report has an average rate for MYR. The rate is units of MYR per 1 SGD: in the example, October is 3.3000.
A missing rate doesn’t show as an error. If the group has no MYR rate for a month, East’s values for that month are read untranslated — back to the problem in step 1.
4Chart the dataset on the group
- With Your Group selected, open a dashboard from Dashboards → Custom and edit it, or create a new one.
- Click Add a widget, and choose Chart.
- Under Data Source, choose Zoho Tag: Outlet from the Operational Data group.
- Group by Reporting Tag Option, and choose the P&L line Sales.
- Click Add Widget, then Save.
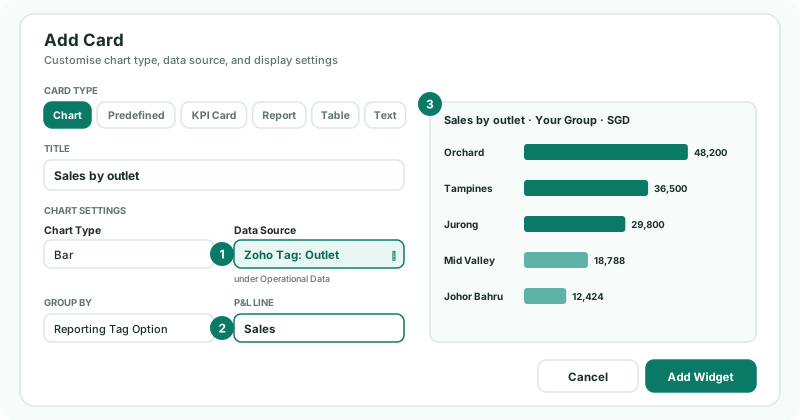
The dataset is read one P&L line at a time — Sales, Rent, Net Profit/Loss — so a chart never adds different lines together. Group by P&L Line instead to see one outlet’s lines.
Check
Mid Valley shows 18,788 — MYR 62,000 ÷ 3.3000 — and South’s outlets show their SGD figures unchanged.
5Use it in reports too
| Custom reports | Rows can read the same dataset, translated the same way. Include Entities on the row lists the companies it reads; untick one to leave it out. |
|---|---|
| Operational reports | Each company’s Zoho tag opens as its own report, named with the company, because Zoho gives every tag an ID of its own in each organisation. For one combined view, use a dashboard or a custom report. |
6If something goes wrong
| East’s outlets look about three times too big | The chart uses a … by Reporting Tag source or a template. Switch the source to Zoho Tag: Outlet. |
|---|---|
| Only one company’s outlets appear | The tag has a different name in the other company, or its months aren’t loaded. Rename the tag in Zoho, refresh it on Reporting Tag Setup, and load the months. |
| One outlet appears twice | The option is spelled differently in the two companies. Make the names match in Zoho and load the months again. |
| One month’s East figures jump | The group has no MYR rate for that month, so it was read untranslated. Add the rate on Exchange Rates. |
| Nothing is translated at all | Currency translation isn’t included in the Standard edition. |
Want more detail? See the documentation