
Row/Column Reports · Track 1 · Tutorial 1 of 7
Know when to use a row/column report
Most reports a group needs are rows down and periods across: sections, accounts, a few formulas, a KPI or two. That is what a row/column report is for. It is quick to build, easy to keep working, and reads the period from the toolbar like the built-in statements.
1Choose the type
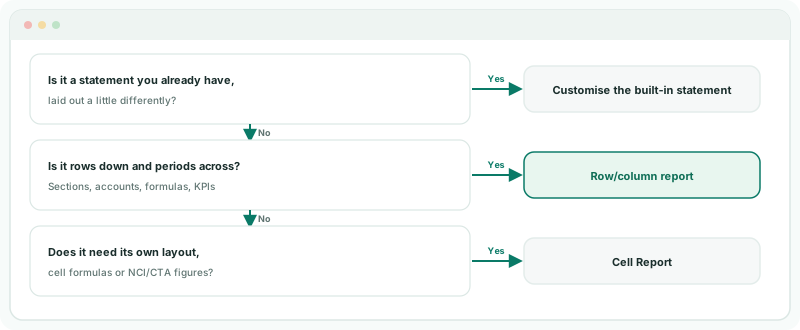
| Type | Use it for |
|---|---|
| Built-in statement, customised | The profit and loss, balance sheet or cash flow with lines grouped or ordered your way. See Customise Profit & Loss. |
| Row/column report | A report of your own, rows down and periods across: a management profit and loss, a cost report, revenue by entity, a KPI pack. |
| Cell-based report | A page with its own layout, spreadsheet formulas, or figures a row can’t hold, such as NCI and CTA lines. See Know when to use a Cell Report. |
When in doubt, start with a row/column report. It is the type the report dialog recommends, and its rows follow sections and accounts as the chart of accounts grows.
2Know what a row/column report is made of
| Row type | Shows |
|---|---|
| Label | A heading, subheading or blank line. |
| Section | A statement section or account type, with its accounts or as a total only. |
| Account | One ledger account, or every account carrying an accounting-standard tag, as one row. |
| Formula | A calculation on other rows: a margin, a ratio, a subtotal. |
| By Entity | A set of rows repeated for each entity. |
| KPI | A KPI, beside the financial rows. |
| Operational Data | Rows from an operational dataset, such as revenue by product or division. |
The columns come from the Period: months of the fiscal year, a rolling window, quarters, actual against budget, or a column set of your own. Readers can change the period on the toolbar, as on any report.
3Plan the management profit and loss
Before you build, write down the lines and the columns. For Your Group’s management profit and loss:
| Line | Row type |
|---|---|
| Revenue, with its accounts | Section |
| Direct costs, as a total | Section |
| Gross profit and gross margin % | Formula |
| Administrative expenses | Account, by accounting-standard tag |
| Revenue by company | By Entity |
| EBITDA margin | KPI |
Columns: the twelve months of the fiscal year with a full-year total. The next tutorials build this report one row type at a time.
Check
Every line in the plan is rows down and periods across. If one isn’t — a note beside a figure, a figure in a header — that page is a Cell Report.
Want more detail? See the documentation