
Row/Column Reports · Track 1 · Tutorial 2 of 7
Create a report and choose its period layout
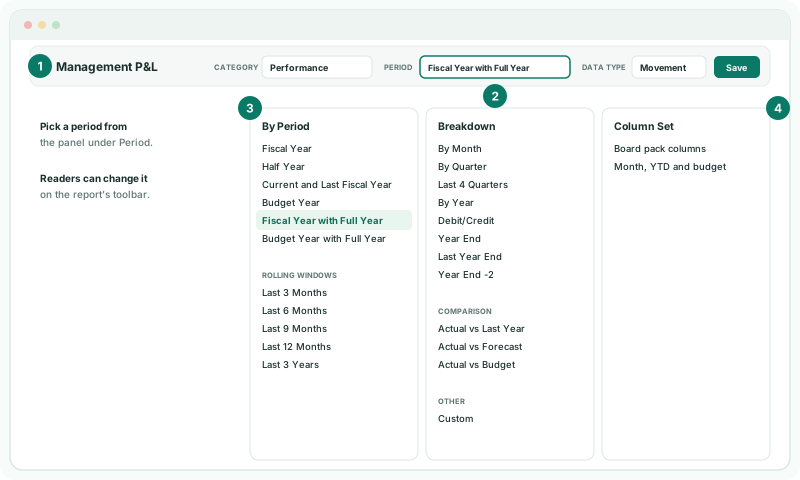
A row/column report’s columns come from one setting: the Period. Choose it before adding rows, so you see each row in the columns readers will get. Readers can still change it on the toolbar.
You will needRights to create reports in Your Group, and the plan from Know when to use a row/column report.
By the endAn empty Management P&L report for Your Group, saved with a title row, showing the twelve months of the fiscal year and a full-year total.
1Create the report
- Select Your Group, open Reports → Custom Reports, and click Add a new report.
- Choose Row/column report.
- In the name box at the top, type Management P&L.
- In Category, choose Performance, and leave Available to on This organisation.
2Choose the period layout
- Click Period and choose Fiscal Year with Full Year.
- Set Data Type to Movement, the right type for a profit and loss. Use Balance for a balance sheet report.
| Period | Columns |
|---|---|
| Fiscal Year | The twelve months of the fiscal year. Months up to the reporting month show actuals, later months the forecast. |
| Fiscal Year with Full Year | The same twelve months, and a full-year total, such as FY-2026. |
| Budget Year, Budget Year with Full Year | The twelve months of the budget, with or without the total. |
| Half Year | Twelve months, with H1 and H2 totals. |
| Last 3, 6, 9 or 12 Months | A rolling window of months ending at the reporting month. |
| By Month | The reporting month alone. |
| Last 4 Quarters | The current quarter and the three before it. |
| Debit/Credit | The month’s debits and credits, and the year-to-date debits and credits. |
| Actual vs Budget | For the month and for the year to date: actual, budget, the variance, and a percentage of revenue. Actual vs Last Year and Actual vs Forecast work the same way. |
| A column set | The columns you defined on Reports → Column Sets. See Set up column sets for periods and comparisons. |
The budget and forecast periods are available only on plans that keep budgets and forecasts.
3Add a title row and save
A report needs at least one row before it can be saved.
- Click the first blank row — click to configure — and choose Label.
- In Label Text, type Management profit and loss, and click Add Row.
- Click Save, then View.
Check
The report shows the title row and thirteen columns: the twelve months of Your Group’s fiscal year and the full-year total. Choose By Month on the toolbar: the same report shows one column.
4If something goes wrong
| What you see | What to do |
|---|---|
| Save is greyed out, or Please add at least one row before saving. | Add a row first, such as the title Label. |
| The name is already in use | Another report has that name. Choose another. |
| Budget Year or Actual vs Budget is greyed out | Your plan doesn’t keep budgets and forecasts. |
| Profit and loss figures look like running totals | Data Type is Balance. Set it to Movement. |
Want more detail? See the documentation