
Read and Customise Reports · Track 2 · Tutorial 4 of 4
Set up column sets for periods and comparisons
A report’s columns come from its period: one month, a quarter, a year. A column set replaces them with your own list of columns, such as this month and the year to date against budget with the variance beside each. Build it once and apply it to any report.
1Know the three kinds of column
| Column Type | What it shows |
|---|---|
| System Period | A period that moves with the reporting month, such as Current Month, Last Month, Same Month Last Year, Current Quarter, Current YTD, Last Year YTD or Year End. Next month the same set shows next month. |
| Fixed Period | One month that never moves, picked from the Fixed Period Value list, such as Dec-2025. |
| Formula / Variance | A column worked out from the other columns in the set. |
System and fixed periods also take a Data Type: Movement or Balance, each for Actual, Budget or Forecast, and Debit, Credit, YTD Debit or YTD Credit.
2Create the set and its period columns
- Open Reports → Column Sets, and click Add Column Set. Create Column Set opens.
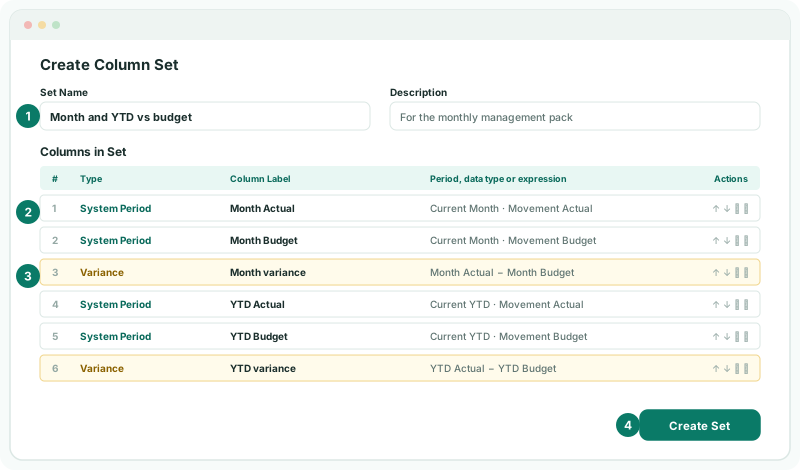
- Enter the Set Name Month and YTD vs budget, and a Description saying what it is for.
- Choose System Period as the Column Type, Current Month and Movement Actual, enter the Column Label Month Actual, and click Add Column.
- Add Current Month, Movement Budget the same way, labelled Month Budget.
Leave the Column Label empty and the column is labelled with its period when you add it, such as Aug-2026. Give it your own label when that wouldn’t be clear.
3Add a variance column
- Choose Formula / Variance as the Column Type, and enter the Column Label Month variance.
- Choose Variance as the Expression Type.
- Build Month Actual − Month Budget from the columns and the operators, and click Add Column.
- Add Current YTD with Movement Actual and with Movement Budget, labelled YTD Actual and YTD Budget, then a YTD variance column of the two.
- Use Move Up and Move Down to put the columns in order, and click Create Set.
| Variance | Convert sign based on account nature: the result is flipped on accounts that normally carry a debit, such as expenses. Actual − budget then reads positive when it is good news on every row — income above budget, costs below it. |
|---|---|
| Formula | The result as written, on every row. Use it for anything that isn’t a difference, such as actual as a share of budget. |
A formula or variance column needs a Column Label of its own.
4Apply the set to a report
- Open Reports → Profit & Loss for Your Group.
- Open the period selector, and under Column Sets choose Month and YTD vs budget.
Check
The report has six columns, in the set’s order. On a revenue row, Month variance is the actual less the budget. On an expense row over budget, Month variance is negative.
The same set can be chosen on any report, and saved as the columns of your own row/column reports. A report using a column set takes its period and data type from the set, so those choices are turned off in the report editor.
5If something goes wrong
| Create Set can’t be clicked | The set has no columns yet. Add at least one. |
| A budget column is empty | No budget is loaded for that period. Load the budget for the year. |
| A variance has the opposite sign to what you expect | It is a Formula column. Edit it and choose Variance as the Expression Type. |
| The set isn’t in the period selector | It was created for a different group. Column sets belong to the top organisation. |
Want more detail? See the documentation