
MYOB Groups · Track 3 · Tutorial 2 of 3
Read jobs and categories as operational data
Available on ProPremium
Every month BrizoConsol loads your jobs and categories, it also keeps them as operational data. That copy is what the group reads in its own currency, and what dashboards and reports are built on.
1Know what each load writes
Every month BrizoConsol works out the profit and loss by job and by category from the MYOB ledger lines it loads. Each time, it also writes the same figures as an operational dataset — a table of figures that dashboards, custom reports and operational reports can read, and that is translated into the group currency on the group.
| Name | Two datasets: MYOB: Job and MYOB: Category. |
|---|---|
| Rows | One figure for each job or category and each P&L line in each month — Harbour St Office’s Total Sales for October is one row. The lines are the report’s own, account lines and subtotals alike — Total Sales, Net Profit. Amounts with no job are kept under Unassigned. |
| Dimensions | Job and P&L Line (Category and P&L Line for MYOB: Category). Every reading takes one line at a time, so different lines are never added together. |
| Currency | Each company’s own: Wattle Fitouts Pty Ltd’s in AUD, Kauri Ltd’s in NZD. |
| When it changes | Loading a month again replaces that month. The dataset is the connector’s, so it can’t be edited or uploaded to by hand. |
2Find the dataset
- Select your group, and open Settings → Organisation Settings → Operational Data.
- Find MYOB: Job in the list. On the group, each company’s dataset is listed with the company’s name under it.
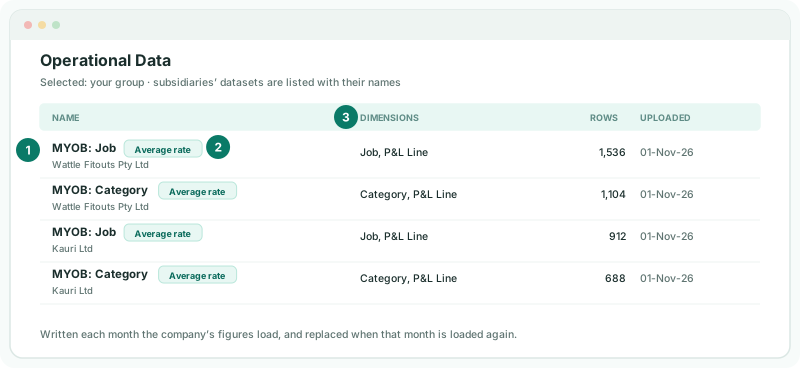
Average rate beside the name says how the dataset is translated on the group. The dataset needs the Free, Pro or Premium edition, which also includes currency translation. A dataset that belongs to a company opens in that company, from the link icon on its row.
3Know how it is translated
Wattle Fitouts Pty Ltd keeps its books in AUD and Kauri Ltd in NZD. Your group reports in SGD.
| On a company | The dataset is read in that company’s own currency. |
|---|---|
| On the group | Each company’s month is translated into SGD at that month’s average rate — the rate the profit and loss uses — before anything is added. |
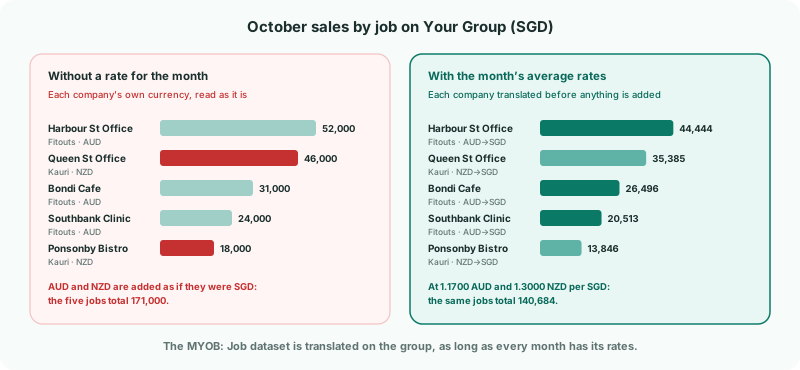
Without the month’s rates, the two companies’ figures would be added as they stand — AUD and NZD as if they were SGD. That is why the dashboards in the next tutorial are built on the dataset.
4Name things the same in every company
Every MYOB company writes to datasets of the same names, MYOB: Job and MYOB: Category, so the group reads each as one source without any renaming.
Each job is listed by its name. Jobs with the same name in two companies fall on the same row — and so does each company’s Unassigned.
5Check the rates
- Select your group, and open Settings → Global Settings → Exchange Rates.
- Check that every month you report has an average rate for AUD and for NZD. Each rate is units of the currency per 1 SGD: in the example, October is 1.1700 for AUD and 1.3000 for NZD.
If the group has no rate for a currency in a month, that company’s figures for the month are added in its own currency, as they stand. The operational report says so above its table; a dashboard chart doesn’t, so check the rates before you rely on a chart.
6Open it as a report
- With your group selected, open Reports → All Reports.
- Under Operational Data, open MYOB: Job.
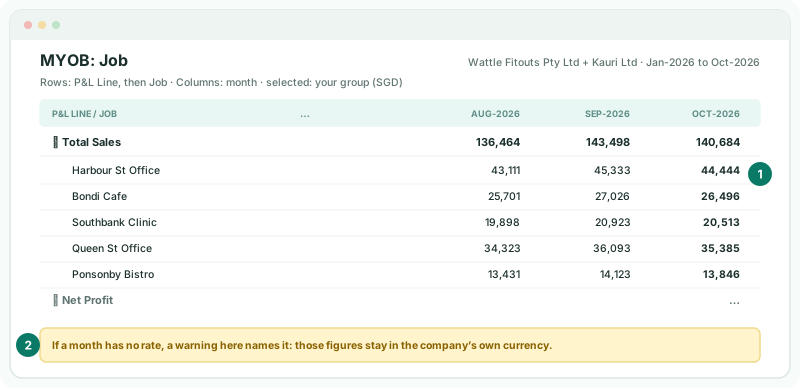
MYOB: Job is one report covering every MYOB company the group reads — and MYOB: Category is another. It opens as a pivot table with the P&L lines down the side and the months across, from the start of the financial year. Drag Job onto the rows to split each line by job, and set the months with From and To.
Check
With your group selected, Harbour St Office’s October Total Sales is 44,444 — AUD 52,000 ÷ 1.1700. Select Wattle Fitouts Pty Ltd instead, and the same figure is AUD 52,000, as in MYOB.
Use the icons at the top to export the report to PDF or Excel, or to add it to an Insight Package.
7Use it elsewhere
| Dashboards | Charts and tables read the dataset the same way — see Build job dashboards from operational data. |
|---|---|
| Custom reports | Rows can read the dataset, translated the same way. Include Entities on the row lists the companies it reads; untick one to leave it out. |
8If something goes wrong
| What you see | What to do |
|---|---|
| MYOB: Job isn’t in Operational Data | No month has been worked out for the company yet. Switch on the profit and loss by job and load the months — see Bring in jobs and categories. |
| Only one company’s jobs appear on the group | The other company’s jobs aren’t worked out for the month. Switch on the profit and loss by job there and load the months. |
| Two jobs share a row | They have the same name in both companies. Rename one in MYOB and load the months again. |
| One month’s figures jump | The group has no rate for that currency in that month, so it was read untranslated. Add the rate on Exchange Rates. |
| No Average rate badge, and nothing is translated | Your plan is Standard. It includes neither currency translation nor this dataset: upgrade to Pro or Premium. |
Want more detail? See the documentation