
MYOB Groups · Track 3 · Tutorial 3 of 3
Build job dashboards from operational data
Available on ProPremium
Build the job dashboard from the operational dataset, and it works on the group: every company’s jobs side by side, translated into the group currency.
1Build on the dataset
Every card on this dashboard reads MYOB: Job, the dataset described in Read jobs and categories as operational data. On your group it is translated into SGD month by month, and it holds every line of the profit and loss, not only revenue and net profit.
There are no dashboard templates for MYOB jobs and categories: every card is built from the datasets, as below. MYOB: Category comes from the invoices and bills that state a category, so it covers sales and purchases only — build sales cards from it, not net profit.
2Start the dashboard on your group
- Select your group.
- Open Dashboards → Custom, and click Add a new dashboard.
- Type Jobs in the name box.
Built on the group, the dashboard shows every company’s jobs together in SGD. Built on one company, the same cards show only its jobs, in its own currency.
3Chart total sales by job
- Click Add a widget, and choose Chart.
- Type a title, such as Total Sales by job, and choose Bar as the Chart Type.
- Under Data Source, choose MYOB: Job from the Operational Data group.
- Set Group by to Job, and P&L Line to Total Sales.
- In the list below, tick the jobs to show — the five largest are ticked to start with.
- Set Period to Last 6 Months, and click Add Widget.
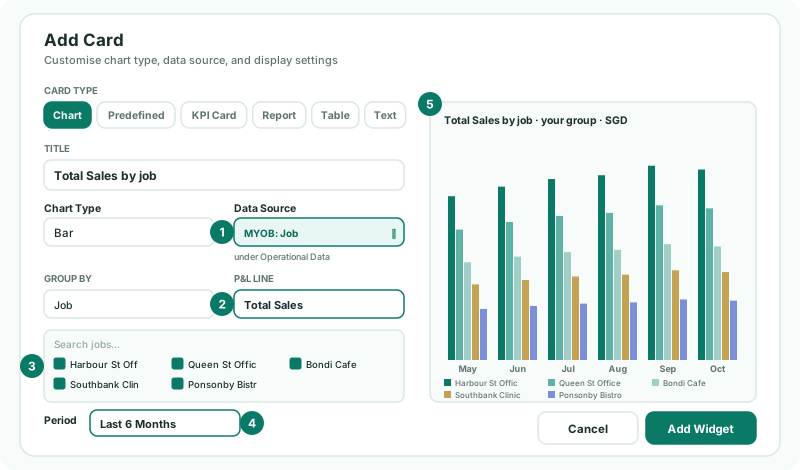
A card reads one P&L line at a time, so it never adds a subtotal to the lines above it. Set Group by to P&L Line instead to see one job’s lines side by side.
4Add net profit over the year
- Add another chart from MYOB: Job, grouped by Job, with P&L Line set to Net Profit.
- Choose Line as the Chart Type and Last 12 Months as the Period, and click Add Widget.
Each job is one line, so a job whose profit falls while the others rise stands out. Unassigned is listed too: it holds what no job carries — often overheads — so it usually shows a loss. Untick it to compare the jobs only.
5Rank the jobs
- Click Add a widget, and choose Table.
- Under Table Type, choose MYOB: Job from Operational Data.
- Set Group by to Job and P&L Line to Total Sales.
- Set Data Type to YTD.
- Under Columns, keep Value and Share %; tick Records or Avg Value if you want them. Click Add Widget.
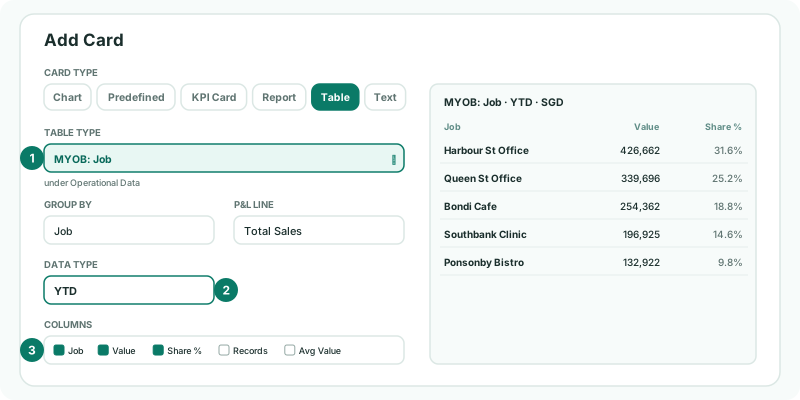
The table lists the top 10 jobs by value, each with its share of the total. Data Type also offers Current Month and vs Last Year.
6Save and read it
- Drag the cards into place, and click Save.
- Open the dashboard from Dashboards → Custom.
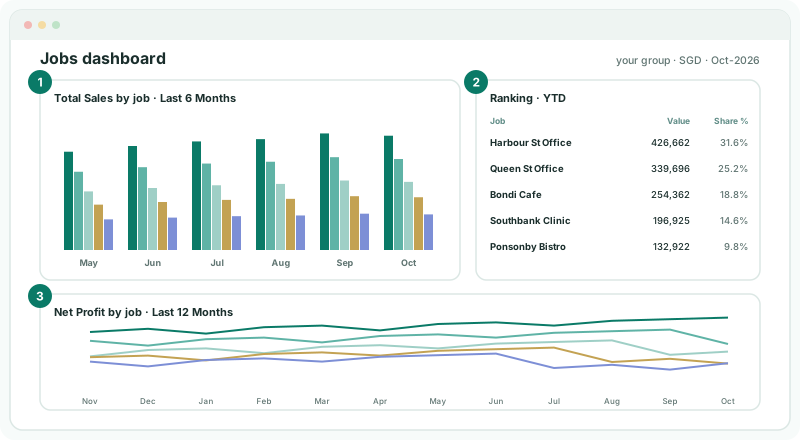
| The bars | Whether each job is growing, month by month. Compare a job with itself, not with a job of a different size. |
|---|---|
| Share % | Where the year’s sales come from. In the example Harbour St Office brings in 31.6% of the year’s Total Sales. |
| The Net Profit lines | Which jobs turn their sales into profit. A job high in the ranking but low here sells a lot at a thin margin. |
Check
October’s bar for Queen St Office is 35,385 — NZD 46,000 ÷ 1.3000. For any job, the table’s Value equals its Total Sales row in the MYOB: Job operational report added up from January to the month you are on, with your group selected.
7Keep it current
The dashboard reads the months that are worked out. The nightly read keeps the last 12 months of jobs up to date. Categories also need the month’s invoices and bills, which the nightly read brings in for the last 3 months. For an older month, or one you changed in MYOB, load it on Data Loading with GL, Invoices, Bills and P&L by Job ticked. A new job appears on its own once it is used in MYOB and the month is loaded.
8If something goes wrong
| What you see | What to do |
|---|---|
| MYOB: Job isn’t in the Data Source list | No month has been loaded for the company yet — see Bring in jobs and categories. |
| The group’s figures look too large for one company | A month has no exchange rate for its currency, so it was read untranslated. Add the rate on Exchange Rates. |
| A job is missing | It has no amounts in the months shown, or it isn’t ticked in the chart’s list. Edit the card and tick it. |
| The chart adds up to more than the profit and loss | It isn’t: each card reads one P&L line. Check which line is chosen under P&L Line. |
Want more detail? See the documentation