
Dashboards and KPIs · Track 3 · Tutorial 3 of 5
Use liquidity and cash KPIs
Profit doesn’t pay suppliers; cash does. The liquidity KPIs show whether the group can meet what falls due soon, and the cash flow KPIs show where the month’s cash came from and went.
1Add the KPIs to Pulse
- Open Pulse → Key Metrics with Your Group selected, and click the Edit icon (the pencil).
- Click Add Section, type Cash, and click Add.
- In the new section, click Add Metric, then click Cash to list those KPIs.
- Click a KPI to read its description and formula, then click Add. Repeat for each KPI you want.
- Click Save.
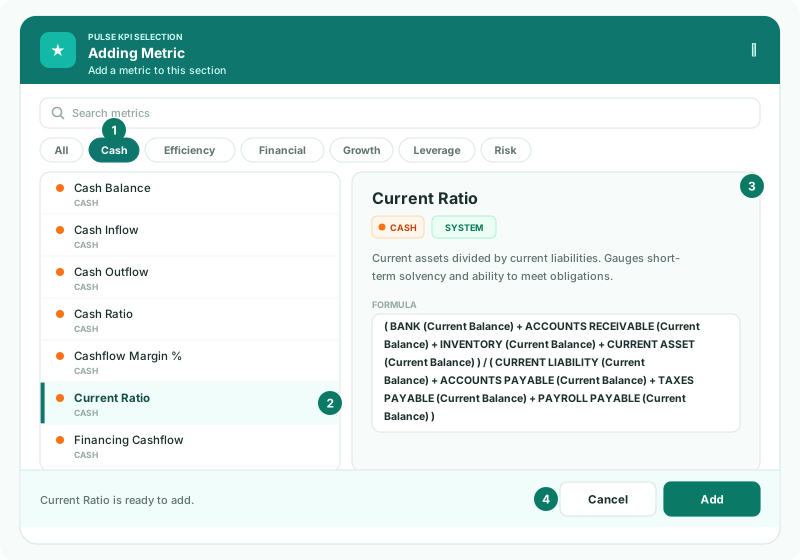
Current Assets is listed under Financial.
In the formula each part is an account section, such as REVENUE, with how it is read: (Current Month) is the movement of the period, (Current Balance) the closing balance, (Average) the average of the opening and closing balance, and (Last Month) the earlier period. The same KPIs are offered on a dashboard KPI card and as a report KPI row; see Set up dashboards and KPIs and Add KPI and operational data rows.
2Know the liquidity KPIs
| Cash Balance | BANK at the closing balance. |
|---|---|
| Current Assets | BANK + ACCOUNTS RECEIVABLE + INVENTORY + CURRENT ASSET. |
| Working Capital | Current assets − current liabilities, where current liabilities are CURRENT LIABILITY + ACCOUNTS PAYABLE + TAXES PAYABLE + PAYROLL PAYABLE. The buffer for day-to-day running. |
| Current Ratio | Current assets ÷ current liabilities, shown as a number such as 1.8: how many times what falls due soon is covered. |
| Quick Ratio | (BANK + ACCOUNTS RECEIVABLE + accounts of the type SHORT TERM INVESTMENT) ÷ current liabilities. A stricter cover that leaves out inventory and other current assets. |
These read closing balances, so MTD and YTD show the same figure: the position at the end of the month.
3Know the cash flow KPIs
| Operating Cashflow | NET PROFIT before interest and finance income and costs, plus DEPRECIATION, less the increase in ACCOUNTS RECEIVABLE, INVENTORY and CURRENT ASSET, plus the increase in ACCOUNTS PAYABLE, CURRENT LIABILITY, PAYROLL PAYABLE and TAXES PAYABLE. |
|---|---|
| Investing Cashflow | Less the spending on FIXED ASSET (its increase before DEPRECIATION) and the increase in NON CURRENT ASSET, plus interest and finance income, less interest expense. |
| Financing Cashflow | The increase in EQUITY other than RETAINED EARNINGS, less finance costs. |
| Net Cashflow | The three together: Operating + Investing + Financing Cashflow. |
These read movements: MTD is the month, YTD the fiscal year to date.
4Check the figures
Check
For Oct-2026, Operating Cashflow + Investing Cashflow + Financing Cashflow equals Net Cashflow. On the Balance Sheet at October, the four current liability sections taken from Current Assets equal Working Capital.
5If something goes wrong
| What you see | What to do |
|---|---|
| There is no pencil icon on Key Metrics | Changing Pulse needs the Administrator or Dashboard Admin role. Ask one to add the KPIs, or use a dashboard KPI card. |
| No KPIs match the current filters. | Clear the search box or click All. |
| This KPI is already in use here. | The KPI is already in another section. Key Metrics holds each KPI once; drag it to the section you want. |
Want more detail? See the documentation