
Dashboards and KPIs · Track 1 · Tutorial 3 of 3
Drill down from a widget to the figures
A figure on a dashboard is only useful if you can see what makes it up. Every card leads to a detail page for its measure, and from there to the postings behind each account.
You will needAn Administrator, Dashboard Admin, Report Admin or Report Viewer of Your Group, with the group consolidated for Oct-2026.
By the endRevenue on Your Group’s Main dashboard traced to its accounts for Oct-2026, and one account to its postings.
1Know where each click goes
| KPI card | Its title or figure opens the detail page. On a card with a line chart, the title opens a side panel with the trend and the details instead. |
|---|---|
| Chart | A bar or point opens the detail page for that series and month; a pie or doughnut slice, for that slice. The chart’s title opens the side panel. |
| Table | An account opens the postings behind it. A section or formula row, such as Gross Profit in Profit Analysis, opens the detail page. |
Right-click anything you can click for Drill or Open drill in new tab.
2Open the detail page
- On Dashboards → Main for Oct-2026, click the Revenue figure.
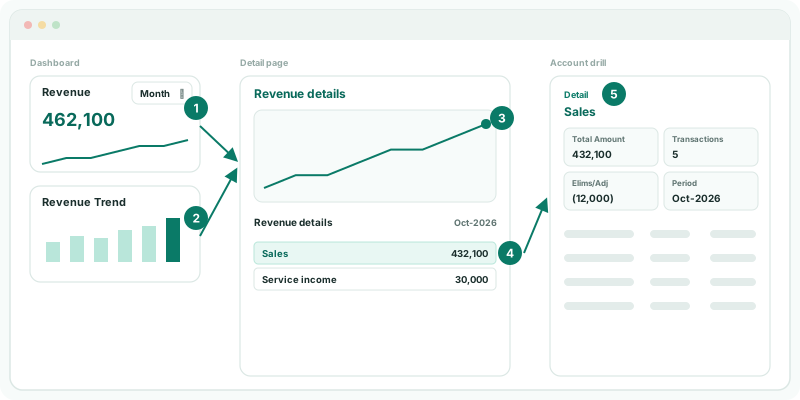
| A section, such as Revenue | A 12-month trend line, and a table of the accounts in the section for the month. Click a point on the line to move the table to that month. |
|---|---|
| A KPI, such as Gross Profit % | Its description and formula, cards for Current Month, Last Month and YTD, its trend, and a details table. |
| Invoice, operational or tracking data | The records behind the series, month by month. |
3Go down to the postings
- In the Revenue details table, click an account, such as Sales.
- Read the postings, filter them by data type, and sort them, as in Drill from any figure to its source.
- Click Detail at the top to go back to the detail page.
Check
With the Revenue card on Current Month, the accounts in Revenue details for Oct-2026 add up to the card’s figure, and each account’s postings add up to its amount.
4If something goes wrong
| What you see | What to do |
|---|---|
| Clicking a chart does nothing | A company view is chosen on the chart. Choose Consolidated first. |
| The detail page shows another month | It opens on the month of the bar or point you clicked. Click the month you want on its trend line. |
| The records behind this series could not be loaded. | Reload the page and drill again. |
Want more detail? See the documentation