
Dashboards and KPIs · Track 1 · Tutorial 2 of 3
Compare periods, currencies and companies on a dashboard
A dashboard answers more than one question once you change what it compares. The header changes every card at once; each card and chart can then be set on its own.
1Change the month
- Open Dashboards → Main.
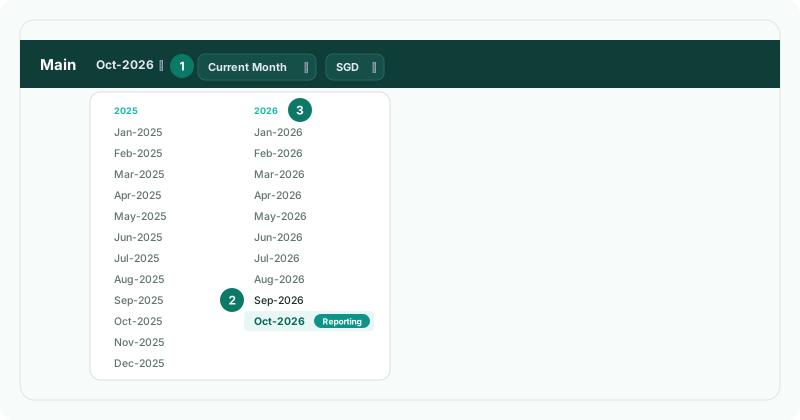
- Click the month beside the dashboard’s name, and choose another, such as Sep-2026. The months are laid out by financial year.
Every card moves to that month, text cards included. If you own the subscription, the month you choose also becomes the group’s reporting month.
2Compare the whole dashboard
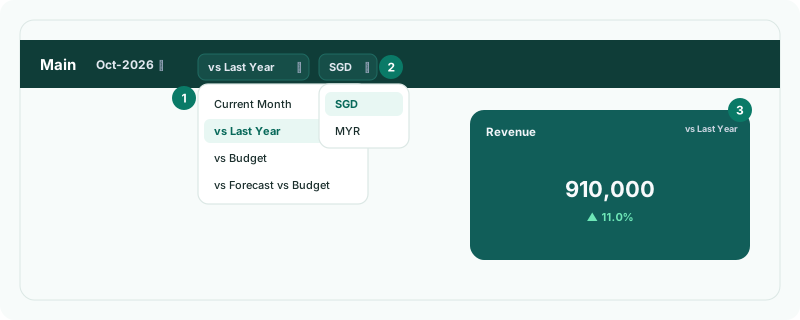
The comparison beside the month applies to every card:
| Current Month | Each card’s own saved setting. The default. |
|---|---|
| vs Last Year | The same month last year. |
| vs Budget | The budget for the month. |
| vs Forecast vs Budget | The forecast measured against the budget. |
KPI cards, tables with a period control and charts switch to the matching comparison. A card that has no such reading keeps its own. On the Standard edition the budget and forecast comparisons are greyed out.
3Change one card
| KPI card | Its selector: Current Month, YTD, vs Last Year, vs Budget, vs Budget YTD or vs Forecast vs Budget. |
|---|---|
| Table | Margin Analysis, Key Ratios, Profit & Loss Summary, the movement tables and the ranked account tables have the same selector, without vs Budget YTD. |
| Chart | Its period list: Last 6 Months to Last 5 Years, vs Last Year, vs Budget, vs Forecast vs Budget, or Custom. Pie, doughnut and radar charts offer Current Month, Year to Date and Custom. |
- On the Revenue card, choose YTD.
- On Revenue Trend, choose Custom. In Custom Period, choose By Month, set the Start Date and End Date, and click Change.
These choices are for this visit only: reloading the page returns each card to its saved setting, and changing the header comparison resets the cards’ own choices.
4Show another currency
- Click the currency code beside the comparison, and choose another currency.
The list holds the presentation currency and every currency in the group’s exchange rates; with only one, it isn’t shown. Your choice is remembered on this browser, and Pulse uses it too.
5Compare companies
| One company’s dashboard | Click the company name at the top of the left navigation and choose a company, such as Demo Sales Company. The dashboard shows that company alone. |
|---|---|
| Every company on one chart | On a line, bar, area or composed chart, open the view list beside the period and choose All Entities: one series per company. Choose a company to show only its figures, or Consolidated to return. |
| Expenses by company | Add the Expenses by Entity chart to a dashboard — see Choose the right widget for each measure. |
The view list is offered on a group that consolidates.
Check
With vs Last Year chosen in the header, every KPI card’s selector reads vs Last Year. With All Entities on Revenue Trend, the chart has a line for each company.
6If something goes wrong
| What you see | What to do |
|---|---|
| vs Budget can’t be chosen | Forecast and budget are not included in the Standard edition. |
| A vs Budget card shows no budget | No budget is loaded for the month. Load it first. |
| There is no currency list | The group’s exchange rates hold no other currency. |
| There is no view list on a chart | The company does not consolidate, or the chart is a pie, doughnut or radar chart. |
| Clicking the chart does nothing | A company view is chosen. Return to Consolidated to drill from the chart. |
Want more detail? See the documentation