
Dashboards and KPIs · Track 2 · Tutorial 2 of 3
Choose the right widget for each measure
The same figure reads differently as a number, a trend or a share. Picking the card for the question — how much, which way, made of what — is most of what makes a dashboard useful.
You will needAn Administrator or Dashboard Admin of Your Group. A dashboard open in the editor, as in Build a custom dashboard.
By the endEach measure on the Monthly Review dashboard shown on the card that answers its question.
1Match the question to the card
| How much this month? | KPI Card, Display Number. Use Data Type YTD for the year so far. |
|---|---|
| How much, and which way is it going? | KPI Card, Number with line chart. |
| How has it moved over the months? | Chart, Line or Bar, Period Last 12 Months. |
| Are we on budget? | Chart, Bar, Period vs Budget; or a KPI Card on vs Budget. |
| What is it made of? | Chart, Pie or Doughnut with Accounts in Section; or Table Revenue by Account or Expense by Account. |
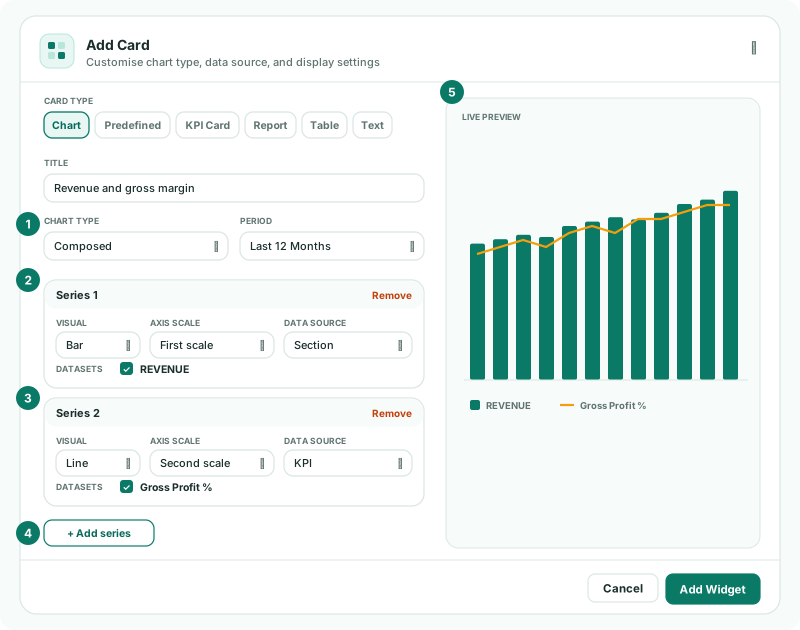
| Two measures on different scales | Chart, Composed, such as revenue as bars and Gross Profit % as a line on a second scale. |
| How did we get from revenue to profit? | Predefined, Net Profit Waterfall. |
| What does it mean? | Text, for commentary. |
2Set up a chart
| Chart Type | Line, Bar, Area, Composed, Pie, Doughnut or Radar. A bar chart can use Stacked bars. |
|---|---|
| Data Source | Section, Accounts in Section, Account or KPI, then any Invoice Data, Operational Data or connector data your companies have. |
| Datasets | The lines or bars to draw. Search the list and tick each one. |
| Period | Last 6 Months, Last 12 Months, Last 18 Months, Last 4 Quarters, 12 Months, the comparisons, Last 3 Years or Last 5 Years. Pie, doughnut and radar charts take Current Month or Current Year. |
| Data Type | Movement for a period’s activity, such as revenue; Balance for a position at the month end, such as receivables. KPIs and configured sources read as Movement. |
| View | Consolidated, All entities, or one company, for line, bar, area and composed charts of a consolidating group. |
| Top N (Leave Blank for all) | For invoice, operational and connector sources: how many items to draw. |
For a Composed chart, set each series on its own: its Visual (Bar, Line or Area), Axis Scale (First scale or Second scale), Data Source, datasets and Colour. Click Add series for the next one.
3Set up the other cards
| KPI Card | Section / KPI lists Dashboard Metrics, KPIs and Sections. Data Type: Current Month, YTD, vs Last Year, vs Budget, vs Budget YTD or vs Forecast vs Budget. |
|---|---|
| Table | Table Type is grouped by Profitability, Assets, Liabilities & Debt and Top Revenue & Expenses, then your own data. The account tables take Top 5 or Top 10; some tables take a Data Type, and data tables a choice of Columns. |
| Predefined | Net Profit Waterfall, Current vs Non Current Assets or Expenses by Entity, for a Month or Year. |
| Report | Custom report or Cell report. A Cell Report card shows the first sheet. |
| Text | Comment, Executive Summary, Note, Overview or Summary. |
Check
For each card, the Live Preview answers its question before you click Add Widget: a revenue trend shows a line per month, a Revenue by Account table its top accounts.
4If something goes wrong
| What you see | What to do |
|---|---|
| Data Type is greyed out | The source is a KPI or a configured source, which read as Movement only. |
| A budget option can’t be chosen | Forecast and budget are not included in the Standard edition. |
| There is no View setting | The company does not consolidate, or the chart type or source has no company view. |
| Cell report is not under Type | The company has no Cell Report yet. |
Want more detail? See the documentation