
Dashboards and KPIs · Track 1 · Tutorial 1 of 3
Use the built-in dashboards
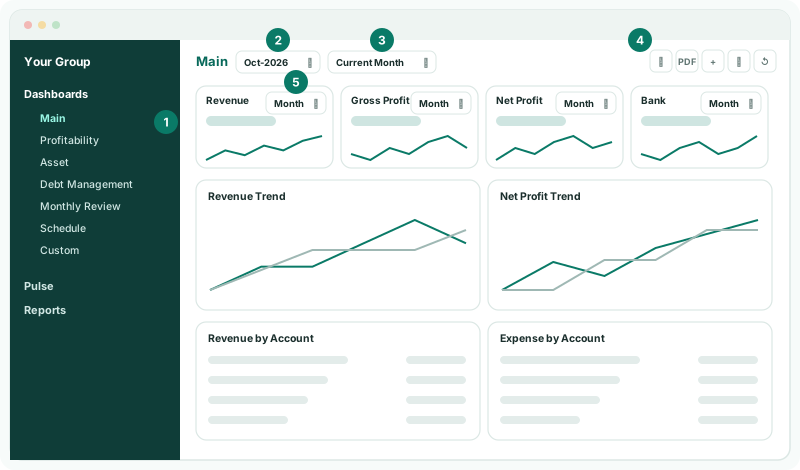
Every group gets four dashboards without any setup: Main, Profitability, Asset and Debt Management. They read the same consolidated figures as the reports, so they are the quickest way to see how the month went.
1Open a dashboard
- Select Your Group at the top of the left navigation.
- Open Dashboards → Main.
| Main | Revenue, Gross Profit, Net Profit and bank cards with a trend line; Revenue Trend and Net Profit Trend against last year; Revenue by Account and Expense by Account (top 5); Expenses Trend; Asset allocation. |
|---|---|
| Profitability | Revenue, Gross Profit, Gross Profit %, Net Profit and Net Profit % cards; an Executive Summary text card; Profitability trend; Revenue and Expense by Account; Margin Analysis; Profit & Loss Summary; Key Ratios. |
| Asset | Total Assets, Current Assets, Non Current Assets, Return on Assets, Current Ratio and Quick Ratio cards; Total Assets trend; Asset allocation; Current vs Non Current Assets; Asset Composition; Asset Movement. |
| Debt Management | Current Ratio, Quick Ratio, Receivables Days and Debt Ratio cards; Accounts Payable trend; Total Liabilities Trend; Liabilities Composition; Liabilities Movement; Debt Summary; Top Liability Accounts. |
In the demo group, Main shows a Sales by Customer table in place of Revenue by Account. Custom dashboards your group builds are listed under the four.
2Read the cards
| KPI cards | The figure for the month, with its change. The selector in the corner shows what the figure is: Current Month, YTD, or a comparison. |
|---|---|
| Charts | Each chart has its own period list, such as Last 12 Months. Click a name under a chart to hide that line or bar; Show all brings them back. |
| Tables | Ranked accounts, margins, ratios or movements for the month. |
| Text | Commentary written for the month, such as the Executive Summary. |
Cards load as you scroll down to them. Every figure can be clicked through to the accounts behind it — see Drill down from a widget to the figures.
3Use the header icons
| Edit | Opens the dashboard in the editor. Administrators and Dashboard Admins only. |
|---|---|
| Export to PDF | A PDF of the dashboard for the month shown. |
| Add to Insight Package | Adds the dashboard to an existing package, or to a new one you name. Administrators and Dashboard Admins only. |
| Dashboard Settings | The colour palette of the charts, saved for the company. Administrators and Dashboard Admins only. |
| Restore default | Shown only once a built-in dashboard has been edited. It removes the company’s own copy, and every card on it, and brings the built-in one back. |
Editing a built-in dashboard changes it for everyone on the company: the first save keeps the company’s own copy under the same name. On the Free edition that copy counts as your one custom dashboard.
4Comment on a card
- Right-click the Revenue card, and choose Add Comment.
- In Comment, type the note. Type @ and a name to mention a teammate.
- Click Add comment.
Check
A comment icon appears beside the card’s title. Hover over the comment icon to read the comment, with your name and when it was written.
5If something goes wrong
| What you see | What to do |
|---|---|
| There is no subscription associated with you. Please add a subscription to continue. | The subscription has been cancelled. Add a subscription on the Subscriptions page. |
| There is no Edit icon | Editing needs Administrator or Dashboard Admin access. |
| Free Plan Limit Reached when you click Edit | The Free edition’s one custom dashboard is already used. Subscribe, or delete the custom dashboard you no longer need. |
Want more detail? See the documentation