
Read and Customise Reports · Track 2 · Tutorial 1 of 4
Customise the profit and loss
The built-in Profit & Loss is the same for every group until you change it. Overriding it keeps its name and its place in Reports, and replaces its rows with yours for the whole subscription. Every change can be undone with Restore default.
1Know what an override changes
| What changes | The rows of the built-in report: which lines it shows, in what order, with what formulas and styles. |
|---|---|
| Who sees it | Everyone in the subscription, on every entity’s Profit & Loss. It isn’t a copy: there is still one Profit & Loss, now with your rows. |
| What doesn’t | The figures. Accounts, eliminations and journals are the same; only the layout is yours. |
| Instead | To keep the built-in report and build your own beside it from an empty report, follow Row/Column Reports. It builds a Management P&L step by step with every row type: Label, Section, Account, Formula, By Entity, KPI and Operational Data. |
2Open the override
- Open Reports → Profit & Loss, and click the Override Report icon in the report’s header.
- In Choose System Report editor, choose Row/column report.
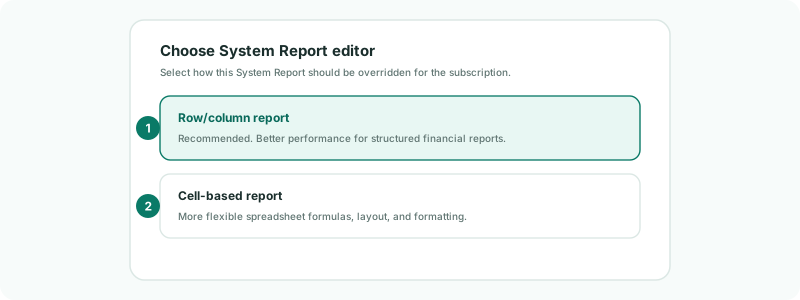
The editor opens with the built-in rows already in it. The name can’t be changed: it is still Profit & Loss. Cell-based report makes a Cell Report from the report’s current figures instead; it is covered in the Cell Reports series. Editions without Cell Reports go straight to the row/column editor.
3Add a margin row
- In the preview, click the first blank row after the report’s rows — it reads click to configure.
- In Add Rows, choose Formula, then Custom Formula.
- In Description, type Gross Margin %.
- From Add Row, choose GROSS PROFIT; click the / operator; choose REVENUE. The Working Formula reads GROSS PROFIT / REVENUE, and Result shows the value.
- Under Display, turn on Percentage, and click Add Row.
- Drag the new row by its :: handle to just under GROSS PROFIT.
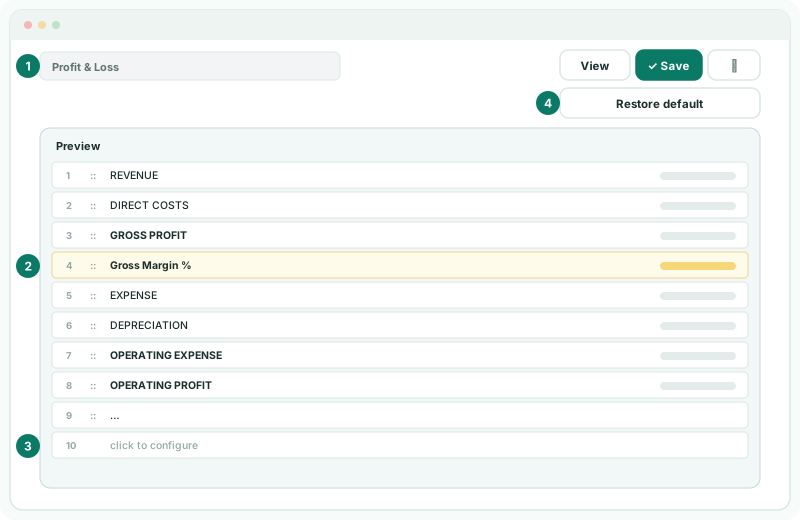
Percentage multiplies the value by 100 and adds the % sign, so the formula is the plain ratio: don’t multiply by 100 yourself. A formula refers to other rows by their label, so rows can be reordered without breaking it.
4Arrange and style the rows
| To | Do this |
|---|---|
| Change a row | Click its label. Edit Rows opens with its settings; change them and click Update Row. |
| Move a row | Drag it by its :: handle. |
| Delete rows | Click the row numbers to select them, then Delete selected. |
| Keep a row for formulas but not show it | Turn on Hide under Display. It shows Hidden in the editor, and formulas can still use it. |
| Style a total | Under Text style, make the Header or the Data bold; under Format, add Background, Underline or Double underline. |
| Space sections out | Under Skip, click Before or After for a blank line above or below the row. |
The gear icon opens Report Settings: Show row totals, Show page total, Hide zero rows by default, Hide zero columns by default and Flip rows and columns.
5Save and check
- Click Save, then View to open the report.
- Open Reports → Profit & Loss for Your Group and for Company A.
Check
Gross Margin % sits under GROSS PROFIT on both, in every period column, and equals GROSS PROFIT divided by REVENUE. NET PROFIT is the same as before the override.
6Go back to the built-in report
- Click Override Report again to open the editor.
- Click Restore default, and confirm Restore the system default report for this subscription?
The override is removed and the built-in rows come back for everyone. Restore default only appears once an override has been saved.
7If something goes wrong
| The Override Report icon isn’t there | Your access is not Administrator or Report Admin. |
| Invalid Formula when you save | A formula uses a row that was deleted. Click the formula row and rebuild it from the rows that are there now. |
| The margin shows as 4,260% instead of 42.6% | The formula multiplies by 100 and Percentage is on. Remove the × 100. |
| NET PROFIT changed after the override | A row its formula refers to was deleted or renamed. Click NET PROFIT and check every row in its formula is still there, or restore the default. |
| Save can’t be clicked | The report has no rows. |
Want more detail? See the documentation