
Row/Column Reports · Track 1 · Tutorial 6 of 7
Repeat rows for each entity
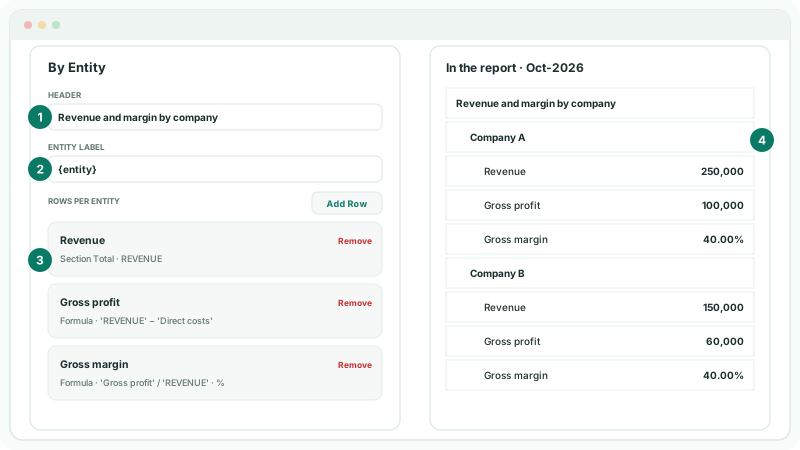
A By Entity row repeats a small set of rows for every company in the group: each company’s revenue, gross profit and margin, one under the other. You set the rows once, and a company added to the group appears without changing the report.
1Add the By Entity row
- Open the Management P&L in the editor. Click the next blank row and choose By Entity.
- In Header, type Revenue and margin by company.
- Leave Entity Label as {entity}. It becomes each company’s name; text around it stays, so {entity} – results gives Company A – results.
2Choose the rows for each company
- Under Rows Per Entity, fill in the row that is already there: type Revenue in Label, set Source to Section Total, and choose REVENUE.
- Click Add Row again and set Source to Formula. Build 'REVENUE' − 'Direct costs' with Add Source Row and the operators, and type Gross profit in Row Label.
- Add a third row, Gross margin, with the Formula 'Gross profit' / 'REVENUE', and tick Percentage.
- Click Add Row at the bottom of the dialog, then Save.
| Source | Shows for each company |
|---|---|
| Section Total | The company’s total for a statement section. |
| Formula | A formula on the report’s rows, worked out with the company’s own figures. 'REVENUE' is the company’s revenue, not the group’s. |
| KPI | A KPI for the company. |
Remove a row with Remove beside it. Each row has its own Bold and italic settings, and rows other than formulas their own indent.
3Read the result
- Click View.
The block starts with the header, then each company in the group, with its three rows under its name, in every column of the report. The companies are the ones you have access to; a company added to the group appears the next time the report is opened.
Check
Company A’s Revenue for Oct-2026 matches Company A’s revenue on Reports → Profit & Loss with Company A selected, in the same currency as the report. Its Gross margin is its Gross profit divided by its Revenue.
4If something goes wrong
| What you see | What to do |
|---|---|
| Add at least one row to repeat by entity. | Add a row under Rows Per Entity before adding the By Entity row. |
| Add at least one complete row for the by-entity group. | Each row needs a Label and its source: a section, a formula or a KPI. |
| A company is missing | You don’t have access to it, or it isn’t in the group. Check your access and the group structure. |
| A margin shows 0.40 | Tick Percentage on that row. |
Want more detail? See the documentation