
Insight Packages · Track 1 · Tutorial 7 of 11
Add tables and analysis blocks
Table sections give ready-made analysis without building a report: margins, ratios, asset and debt summaries, and the largest revenue and expense accounts.
You will needAn Administrator, Report Admin or Dashboard Admin of Your Group.
By the endA Key Ratios table, and a Revenue by Account table beside commentary.
1Add a table
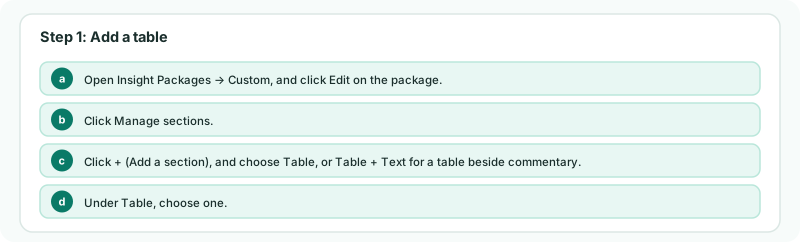
- Open Insight Packages → Custom, and click Edit on the package.
- Click Manage sections.
- Click + (Add a section), and choose Table, or Table + Text for a table beside commentary.
- Under Table, choose one.
| Profitability | Profit Analysis, Profit & Loss Summary, Margin Analysis, Key Ratios |
|---|---|
| Assets | Asset Composition, Asset Movement |
| Liabilities & Debt | Current Liabilities Composition, Liabilities Movement, Debt Summary, Top Liability Accounts |
| Top Revenue & Expenses | Revenue by Account, Expense by Account |
2Finish the table
- For Revenue by Account or Expense by Account, choose Top 5 or Top 10 under Top.
- For a combined section, choose the Layout: Table left, text right or Text left, table right.
- Click Add Section, then Save changes.
Check
The Revenue by Account table lists the same top accounts as the profit and loss for the month.
Want more detail? See the documentation