
Insight Packages · Track 1 · Tutorial 9 of 11
Lay out pages with layouts and the free canvas
Most pages are one section each. When a page needs more, combine a chart or table with text, open a part with a title page, or place blocks freely on a canvas.
You will needAn Administrator, Report Admin or Dashboard Admin of Your Group.
By the endA Page Title page opening the financial statements, and a free canvas page with a chart, a commentary block and an image.
1Use the built-in layouts
| Chart + Table | Chart left, table right; or table left, chart right. |
|---|---|
| Chart + Text | Chart left, text right; or text left, chart right. |
| Table + Text | Table left, text right; or text left, table right. |
| Page Title | A heading on a page of its own, such as Financial statements. |
Use Start from new page to begin a page, and Subsection to keep a section on its parent’s page in the contents.
2Add a free canvas page
- Open Insight Packages → Custom, and click Edit on the package.
- Click Manage sections.
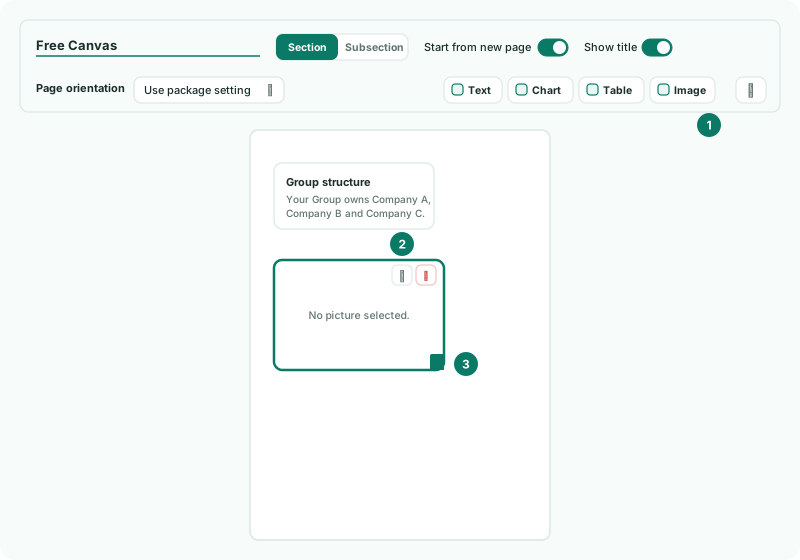
- Click + (Add a section), choose Free Canvas, and click Add Section.
- On the section bar, click Text, Chart, Table or Image to add a block.
- Drag a block to move it, and drag its handle to size it.
- Click a block’s Block settings to set what it shows. A chart or table block is set like a chart or table section; a text block can hold variables.
3Add an image
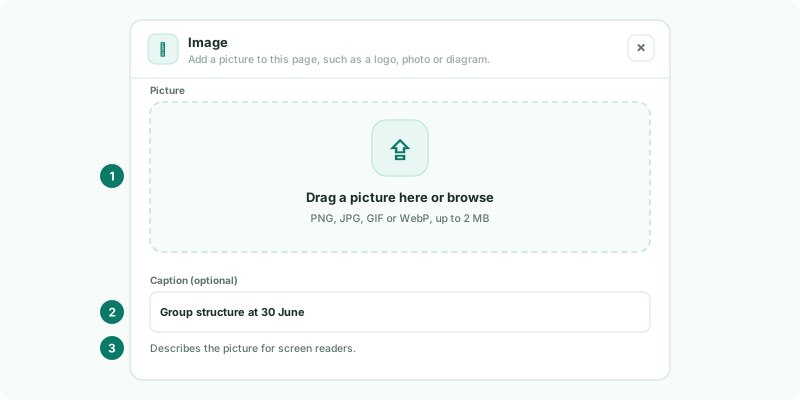
- Add an Image block, and open its Block settings.
- Choose the Picture, and type a Caption (optional), such as Group structure at 30 June. The caption describes the picture for screen readers.
- Click Save changes.
Check
The canvas page in the preview shows each block where you placed it, and the PDF matches.
Want more detail? See the documentation