
Insight Packages · Track 1 · Tutorial 6 of 11
Build charts in a package
A chart section draws its own chart from the ledger or a KPI, without needing a dashboard first. It can stand alone, or sit beside a table or your commentary.
You will needAn Administrator, Report Admin or Dashboard Admin of Your Group.
By the endA bar chart of revenue by month in the package.
1Add a chart
- Open Insight Packages → Custom, and click Edit on the package.
- Click Manage sections.
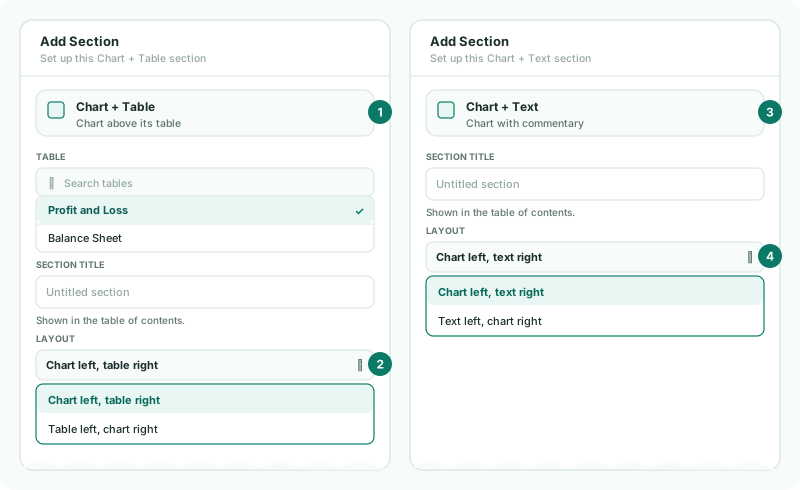
- Click + (Add a section), and choose Chart. For a chart beside a table or text, choose Chart + Table or Chart + Text.
- Type the chart’s Title.
2Set the chart
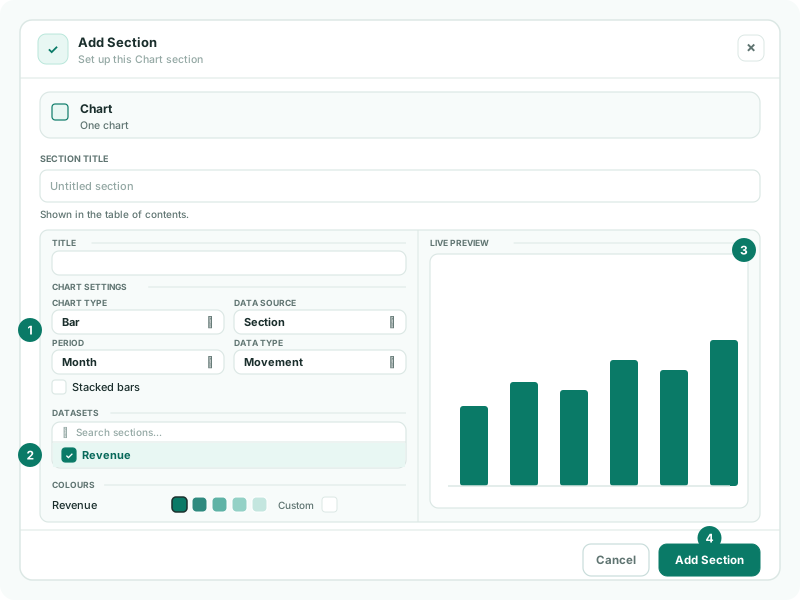
| Chart Type | Line, Bar, Area, Composed, Pie, Doughnut or Radar. |
|---|---|
| Data Source | Section, Accounts in Section, Account or KPI, and any further sources your group has set up. |
| Period | Month, Quarter or Year. |
| Data Type | Movement for activity in the period, Balance for the position at its end. |
| Datasets | The lines or bars to draw. |
| Colours | One colour per dataset. |
- Choose Bar, Section, Month and Movement, and pick the revenue section under Datasets.
- Check the Live Preview, and click Add Section.
A bar chart can also use Stacked bars. A Composed chart has no single source: choose a source and a visual for each series instead.
3Place it beside a table or text
For a combined section, Layout sets the sides: Chart left, table right or Table left, chart right; Chart left, text right or Text left, chart right.
- Click Save changes.
Check
Each bar matches the month’s revenue in the profit and loss.
Want more detail? See the documentation