
Ownership and NCI · Track 5 · Tutorial 1 of 3
Read the NCI Report month by month
The NCI Report shows how every NCI figure for a subsidiary was worked out: what it started from, the percentage applied, the rate, and the account it went to. Read it each month to explain the NCI before you report it, and whenever a figure on the balance sheet or profit and loss looks wrong.
1Open the report
- Open Ownership & Equity → NCI Report.
- Choose Actual as Scenario. Budget and Forecast show the NCI on those figures instead.
- Choose YTD as Basis, and Oct-2026 as As at period.
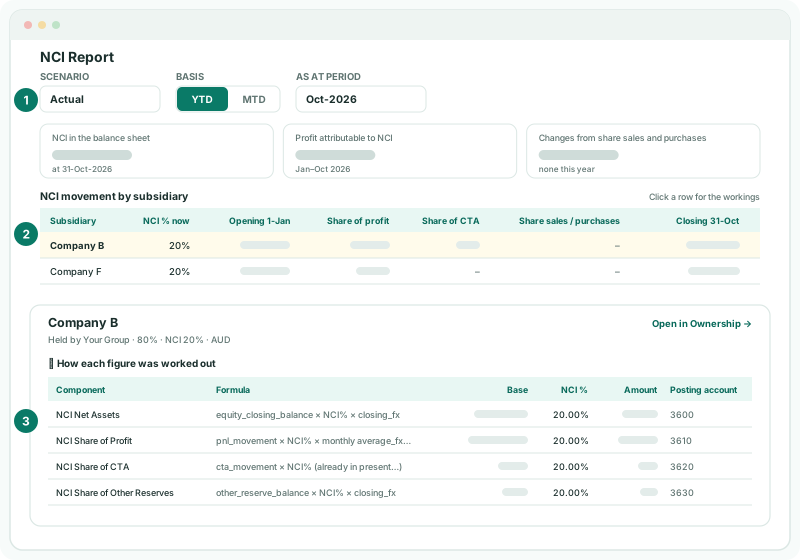
The report covers every subsidiary with an NCI, as at the end of the month you choose. Company B reports in AUD, so its bases are translated into SGD before the NCI % is applied.
2Read NCI movement by subsidiary
Above the table, NCI in the balance sheet, Profit attributable to NCI and Changes from share sales and purchases give the group’s totals. The table has a row for each subsidiary with an NCI: NCI % now, the NCI at the opening date, its Share of profit, Share of CTA and Share sales / purchases, and the NCI at the closing date. Subsidiaries the group owns outright are named under the table as wholly owned.
Start here. If NCI % now for Company B isn’t 20%, every figure for it is wrong for the same reason: an ownership record. Correct it on the Ownership page, not here: Open in Ownership → on Company B’s card takes you there.
3Read each component
- Click Company B’s row. Its card opens below, showing how its NCI got from the opening to the closing balance.
- Open How each figure was worked out.
Each row has a Component, a Source period, a Formula, a Base, an NCI %, an Amount and a Posting account.
| Component | Formula | What the base is |
|---|---|---|
| NCI Net Assets | equity_closing_balance × NCI% × closing_fx | One row for each of Company B’s equity accounts — share capital, retained earnings, dividends paid — at its closing balance. The year’s profit isn’t here; it is the next component. |
| NCI Share of Profit | pnl_movement × NCI% × monthly average_fx (segmented by ownership period) | One row for the profit for the year to date, each month at that month’s average rate, as it is posted. If the NCI % changed during the year, each part of the year uses its own percentage. |
| NCI Share of CTA | cta_movement × NCI% (already in presentation currency) | The translation reserve posted for Company B. It is already in SGD, so no rate is applied. A second row, with the formula cta_cye_translation_gap × NCI% (already in presentation currency), shares the translation difference on the year’s profit. |
| NCI Share of Other Reserves | other_reserve_balance × NCI% × closing_fx | Company B’s other reserves, such as revaluation, at their closing balance. |
In the month of a purchase or a sale, the report also has the rows for that transaction, as in Read the acquisition entries line by line, and a later purchase or a sale is worked out under Share sale and purchase workings.
4Switch to the month
- Click MTD.
The table now opens at 1-Oct, and the share of profit is October’s movement only, at October’s average rate. This is what changed this month: use MTD to explain the month’s movement in the NCI, and YTD to explain the balance.
5Follow one row
With MTD, Company B’s NCI Share of Profit row reads:
| Component | NCI Share of Profit |
|---|---|
| Base | Company B’s profit for October, already translated at October’s average rate |
| NCI % | 20.00% |
| Amount | 20% of the base |
| Posting account | 3610 NCI - Share of Profit |
Each row is that simple: base times NCI % gives the amount. Add the rows of a component, and you have the NCI’s share for it. The same amount is the Share of profit, Oct 2026 line in the card’s bridge, with the sum beside it.
6Tie it to the statements
- Open Journal lines posted for Oct 2026 in Company B’s card, or open Review → Elim. & Journals Report for Oct-2026 and open Auto NCI P&L Oct 2026 (Company B).
Check
With MTD, the report’s NCI Share of Profit amount equals that entry’s total: Company B’s NCI share of profit posted for October. With YTD, it equals the Auto NCI P&L entries for Company B from January to October. The NCI lines in equity on Reports → Balance Sheet include Company B’s NCI Net Assets, CTA and other reserves components.
Export the report with the PDF or Excel icon at the top for the audit file. To show NCI figures in a pack, a cell report can read them from the NCI calculation source.
7If something looks wrong
| What you see | What to do |
|---|---|
| Every NCI % is wrong | An ownership record is wrong. Check Company B’s Share purchases and sales on the Ownership page. |
| One base is wrong | Company B’s own figure is wrong, or its account is mapped wrongly. Drill into it on Company B’s own reports. |
| The amounts don’t match the rate you expect | Check the closing and average rates for the month in Settings → Global Settings → Exchange Rates. |
| No NCI Share of CTA rows | Company B’s CTA isn’t enabled, or NCI - share of CTA isn’t set. |
| No NCI calculation lines found as at this period. | The month is before the acquisition, or Company B has no NCI. |
| The page shows an upgrade message | The NCI Report isn’t in the Standard edition. |
Want more detail? See the documentation