
Foreign Currency · Track 4 · Tutorial 3 of 3
Compare entity and group currency figures
A foreign company’s figures can be read three ways: in its own currency, as its books show them; in the group currency; and as its column in the group’s reports. Knowing how the three relate lets you answer the company’s finance team and the group’s at the same time.
1Know the three views
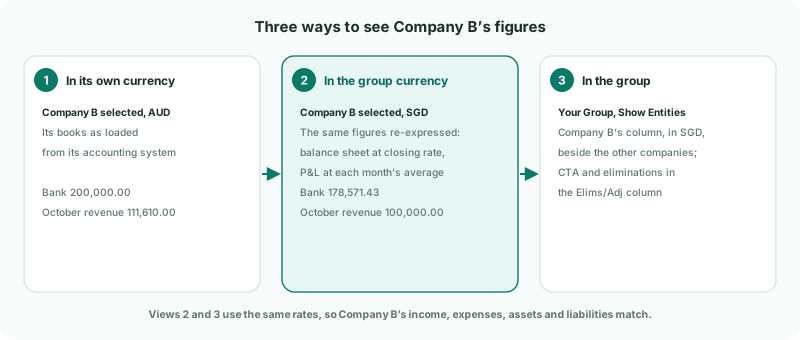
| In its own currency | Company B’s reports open in AUD, its own currency: the figures as loaded from its accounting system. This is what its local finance team sees. The currency selector also lists the group’s currency and every currency on Exchange Rates. |
|---|---|
| In the group currency | The same reports with SGD chosen in the currency selector. Balance sheet lines are at the month’s closing rate, and profit and loss lines at each month’s average rate. |
| In the group | The group’s reports with Show Entities on: a column for each company in SGD, then Elims/Adj, then the group. Elims/Adj is the group figure less the companies’ columns, so the CTA, eliminations and group journals are there. |
2Read the company in AUD and in SGD
- Select Company B, and open Reports → Balance Sheet for Oct-2026. It opens in AUD.
- In the report’s currency selector, choose SGD.
- Do the same with Profit & Loss.
| Line | AUD | SGD |
|---|---|---|
| Bank, at the end of October | 200,000.00 | 178,571.43, at the closing rate of 1.1200 |
| Revenue for October | 111,610.00 | 100,000.00, at October’s average rate of 1.1161 |
For the year to date, each month’s profit and loss is at that month’s average rate, and the months are added up. Dividing the year’s AUD total by one rate gives a different figure.
3Find the company in the group’s reports
- Select Your Group, and open Reports → Profit & Loss for Oct-2026.
- Turn on Show Entities. It is available for Actual figures.
- Do the same with Balance Sheet.
Company B’s column is in SGD, at the same rates as its own reports in SGD. What changes between its column and the group total is in Elims/Adj:
| Eliminations | Intercompany sales, balances and dividends with the other companies, removed. |
|---|---|
| CTA | The entries that keep Company B’s share capital and reserves at their historical rates, against 3500 CTA Reserve. They are posted to the group, not to Company B. |
| NCI and acquisition entries | The NCI’s 20% of Company B, and the elimination of its equity at the acquisition. |
4Check the views agree
Check
Company B’s revenue and bank in its own reports in SGD are the same as in its column on the group’s reports: 100,000.00 for October’s revenue and 178,571.43 for the bank. Each AUD figure divided by its rate gives the SGD figure.
When the company’s finance team and the group’s quote different figures, start here: the AUD figure is the books, the SGD figure is the translation, and anything else is in Elims/Adj.
5If something goes wrong
| A month shows nothing in SGD | AUD has no rate of that type for the month. Enter it on Exchange Rates, as in Manage closing and average exchange rates. |
| The SGD figures are many times too big or small | The rate is the wrong way round. It must be AUD per 1 SGD. |
| Show Entities isn’t there | The report is showing Budget or Forecast figures. Show Entities is for Actual figures. |
| The currency selector isn’t there | The subscription is on Standard, which shows reports in the entity’s own currency only. |
Want more detail? See the documentation