
Cell Reports · Track 2 · Tutorial 3 of 6
Separate parameters, data and presentation across sheets
Available on ProPremium
In a small report the choices, the figures and the layout can share one sheet. As a report grows, keep them apart: a Summary sheet laid out for readers, a Settings sheet with the choices, and a Data sheet with the bound figures. The layout can then be reworked without touching a binding.
1Know what goes where, and in what order
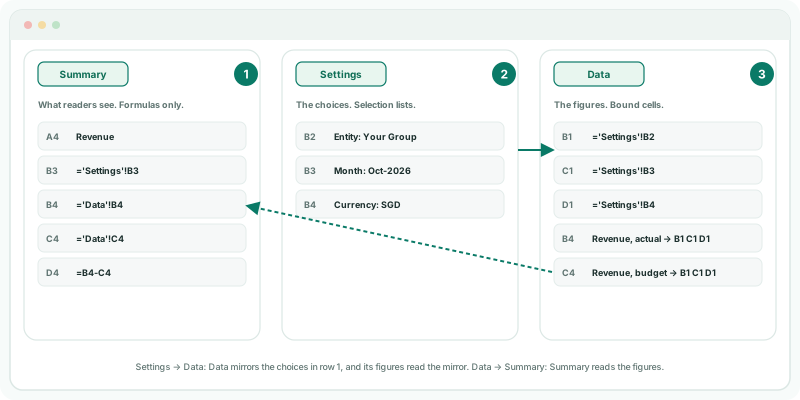
| Summary | The first sheet: headings, labels, formatting, and formulas that read Data. It is the sheet a dashboard card shows. |
|---|---|
| Settings | The choices: entity, month and currency selection lists, or an Entity information cell for the reporting month. |
| Data | The bound figures, laid out for binding, not for reading. |
Two rules shape the layout. A figure’s Cell reference reads a cell on its own sheet only, so Data copies the choices into its own row 1. And BrizoConsol works the sheets out in order, left to right, so Settings must come before Data. Add sheet adds a sheet at the end, so add Settings first, then Data.
2Set up Settings
- Open the monthly summary in the editor. Its sheet is the Summary: type Summary in the Sheet name box.
- Click Add sheet and name the new sheet Settings.
- In A2 to A4 type Entity, Month and Currency. Make B2, B3 and B4 selection lists of Entities, Periods and Currencies, with the Selected values Your Group, Oct-2026 and SGD.
To have the month roll forward on its own, make B3 an Entity information cell showing Reporting month instead. See Drive every period from one reporting-month cell.
3Set up Data
- Click Add sheet and name it Data.
- In B1, C1 and D1 enter
='Settings'!B2,='Settings'!B3and='Settings'!B4. They show Your Group, Oct-2026 and SGD. - Bind the figures in rows 4 to 8 as on the old Summary: revenue actual in B4, budget in C4, and so on. For each, tick Cell reference beside Entity with B1, link Reporting month to C1, and tick Cell reference beside Presentation currency with D1.
Row 1 is the Data sheet’s copy of the choices. Every figure on Data reads it, so there is one place on the sheet that names the entity, month and currency.
4Point the Summary at Data
- On Summary, click B3 and enter
='Settings'!B3, so the heading is the month the figures show. - Replace each bound figure with a formula reading Data: B4
='Data'!B4, C4='Data'!C4, and so on. - Leave the variance and margin formulas as they are: they read B and C on the Summary.
- Delete the old choices from the Summary, and click Save.
Check
Click View. The Summary shows the same figures as before. On Settings, choose Company B: the Summary shows Company B’s figures, and B3 still names the month they are for.
5Know what you give up
A Summary cell that reads Data is a formula, and formulas don’t drill. Readers drill from the Data sheet instead. On a dashboard card, which shows the first sheet only, the Summary’s figures can’t be drilled at all.
Readers also change the choices on Settings, not on the page they read. For a short report read on screen, one sheet with the choices at the top is easier. Split it when the layout changes often, when several people work on it, or when one Data sheet feeds more than one page.
6If something goes wrong
| What you see | What to do |
|---|---|
| Data’s figures show #VALUE! | Check Settings is to the left of Data, and that B1 to D1 on Data show the choices. |
| A reference to Settings!B2 shows red | A figure’s Cell reference takes a cell on its own sheet only. Use Data’s row 1. |
| A formula reading another sheet shows the wrong figure or an error | Check the sheet’s name doesn’t look like a cell, such as Q1 or FY26: a fill or a save can read it as one. Rename it, such as Data or Settings, and fix the formula. |
| The Summary no longer drills | Its figures are formulas. Drill from Data. |
Want more detail? See the documentation