
Cell Reports · Track 2 · Tutorial 1 of 6
Drive every period from one reporting-month cell
Available on ProPremium
A Cell Report that names its month in many places has to be changed in many places every month-end, and one missed cell shows last month’s figure under this month’s heading. Put the month in one cell, have everything read it, and the report rolls forward on its own.
1Choose what sets the month
The month cell can be set two ways. Pick one before you start.
| B3 is | What happens at month-end | Use it when |
|---|---|---|
| Entity information, Reporting month | B3 moves with the reporting month. Nothing to change in the report. | The report is read for the current month: a dashboard card, a pack section, a monthly review. |
| Selection list, Periods | Readers can pick another month in View, but the report opens on its Selected value, which you change and save each month. | Readers need to look back at other months. |
Either way, the rest of this tutorial is the same: every figure and heading reads B3.
2Make B3 follow the reporting month
- Open the monthly summary in the editor and click B3.
- Set Cell type to Entity information.
- Set Entity to Your Group and Information to Reporting month.
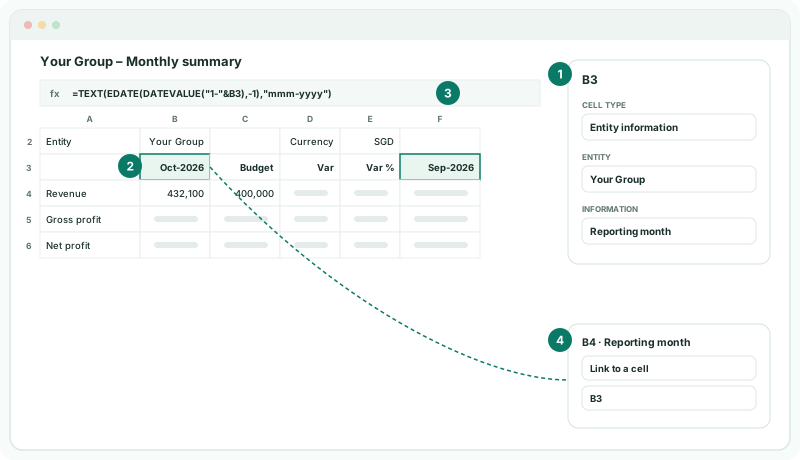
B3 shows Oct-2026. If you keep B3 as a selection list instead, skip this step.
3Point every figure at B3
- Click each bound cell in turn — B4 to B6, C4 to C6 and B8 for the monthly summary.
- Under Reporting month, check it says Link to a cell with B3. Change any cell that says Fixed month or Reporting month.
- Click Save.
A figure on Fixed month never moves. A figure on Reporting month moves, but on its own: it doesn’t follow B3 if B3 is a selection list, and it can’t be offset for a prior-month column. Linking everything to B3 keeps one place in charge.
The Budget column reads B3 too: same month, Version Budget. The variance formulas need nothing; they read B and C.
4Add a prior-month column
- Click F3 and enter
=TEXT(EDATE(DATEVALUE("1-"&B3),-1),"mmm-yyyy"). It shows Sep-2026. - Bind F4 to F6 like B4 to B6, with Reporting month linked to F3.
- Click Save.
The formula turns B3 into a date, moves it back one month, and turns it back into a month like Sep-2026, which a figure can read. The heading is the month the column shows, so the report can’t show August’s figure under a September heading.
For the same month last year, use -12 in place of -1, in a column the chart from Sort, filter and chart a Cell Report doesn’t cover.
Check
F4 matches Your Group’s revenue on Reports → Profit & Loss for Sep-2026.
5Roll forward at month-end
When the reporting month moves on to Nov-2026 with the period selector at the top of the screen, open the monthly summary. B3 shows Nov-2026 and F3 Oct-2026, and every figure follows. The dashboard card and pack section that use the report follow too.
The reporting month is set for the subscription, so every report on Reporting month moves together. If B3 is a selection list, change its Selected value to Nov-2026 and save instead.
Check
Nothing in the report names a month except B3’s setting. Every other month on the sheet is B3 or a formula that reads it.
6If something goes wrong
| What you see | What to do |
|---|---|
| One figure stays on last month | It is on Fixed month. Link its Reporting month to B3. |
| F3 shows #VALUE! | B3 is empty or doesn’t hold a month. Check B3’s settings. |
| The F figures show the same month as B | They are linked to B3, not F3. Fix the cell in Link to a cell. |
| A figure doesn’t follow a month chosen in View | It is on Reporting month, not linked to B3. Link it to B3. |
| A reference box shows red | It isn’t a cell, such as B or 3B. Enter a cell like B3. |
Want more detail? See the documentation