
Cell Reports · Track 1 · Tutorial 7 of 12
Let rows grow with the chart of accounts
Available on ProPremium
A Cell Report row normally reads one fixed line, so an account added next month needs a row added by hand. A sheet can instead hold one template row that BrizoConsol repeats for every account a source returns. The built-in Expenses report works this way, and it is the quickest way to see how.
1Know how a sheet grows
| Setting | What it does |
|---|---|
| Source | What the rows come from: Profit & Loss detail or Balance sheet detail, one row per account of a section; Trial balance, one row per account; Operational data, one row per line; Source documents, one row per document. |
| Template row | The row repeated once for each line the source returns. |
| First row to fill | Where the first copy goes, usually the template row itself. |
| Arguments | What the source needs, such as the month and the section. Each comes from a Cell on the sheet, such as the month a reader picked, or a fixed value. |
| Placeholders | {name}, {code} and {display_name} become the line’s own values; {row} becomes the row number of each copy. |
The rows below the template move down to make room, and their formulas, conditional formatting, merged cells and charts move with them. The template is repeated each time the report is opened or exported, so the rows always match the chart of accounts of the moment.
2See it in Expenses
- Select Your Group, and open Reports → All Reports. Filter on Performance, and open Expenses.
- Choose Oct-2026 in B2.
Between the Expense heading and Total Expense there is one row for each expense account: the month’s actual, the same month last year, the Variance and the % of Revenue, then the same for the year to date. No one typed those rows. They come from row 8 of the workbook.
3Open the template
- Click Edit, the pencil at the top of the report.
BrizoConsol copies Expenses into a Cell Report of your own and opens it in the editor. Like any replaced built-in report, it is what everyone in the subscription sees from now on, and Restore default brings the built-in one back, as in Replace a built-in statement with a Cell Report.
| Cell | Holds |
|---|---|
| A8 | {display_name}: the account’s name, with its code in front when Show Account Code is on in Report Settings. |
| B8, C8 | Financial data reading the account of the row, for the month in B5 and the same month last year in C5. |
| D8 | =B{row}-C{row}: each copy subtracts its own two cells. |
| E8 | =IFERROR(B{row}/$J$3,0): the share of revenue, read from the hidden J3. |
| F8 to I8 | The same for the year to date. |
4Read the settings
- In the toolbar, under Sheet, click Sheet options (⋯), then Rows grow with the chart of accounts….
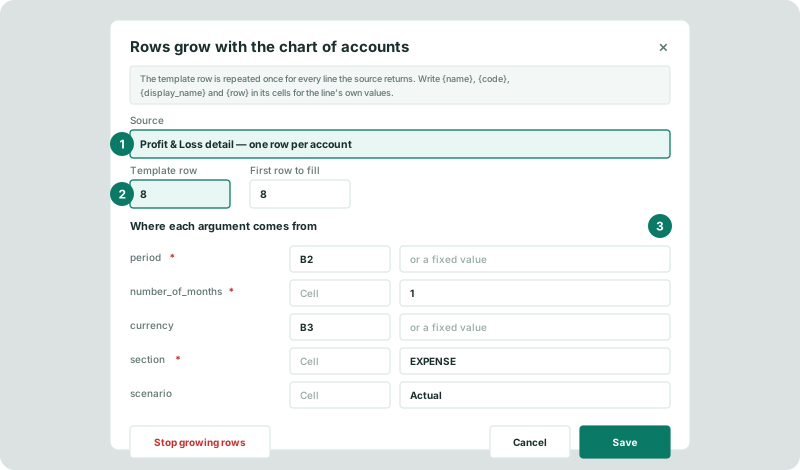
The month and the currency come from B2 and B3, so the rows follow what the reader picks; the section is the fixed value EXPENSE. Change it to another section, such as DIRECT COSTS, and the same template lists that section’s accounts instead.
Every argument needs a cell or a value before you click Save. If scenario is empty, type Actual: a blank scenario is refused when the report is read.
Click Cancel to leave the settings as they are.
5Add a column to the template
- If column L isn’t on the grid, open Sheet options and raise Columns.
- In L5 type Change %.
- In L8 type =IFERROR(D{row}/C{row},0), and set its Number format to Percentage.
- In L9, the total row, type =IFERROR(D9/C9,0) and format it the same way.
- Click Save.
Columns J and K are hidden helpers that hold revenue, so L sits next to I on the page. The template formula uses {row}, so each account’s copy divides its own variance by its own last-year figure. L9 is an ordinary cell below the template, so it moves down with the total row and keeps pointing at it.
6Check it
- Click View, and choose Oct-2026 in B2.
- Add an expense account to the chart of accounts, map it, and load a month with an amount on it. Open Expenses again.
Check
Every expense account has a Change % beside it, and Total Expense has its own. The new account has a row of its own, with all its columns, and Total Expense has moved down one row with its figures intact. Export to Excel: the workbook has the same rows.
7Stop the rows growing
Open Rows grow with the chart of accounts… again and click Stop growing rows. Row 8 is then an ordinary row: it shows its placeholders as typed, such as {display_name}, until you replace them with fixed rows. To return Expenses to the built-in report, click Restore default at the top of the report.
8If something goes wrong
| What you see | What to do |
|---|---|
| Save is greyed out in the dialog | No Source is chosen, or a required argument, marked *, has neither a cell nor a value. |
| The report won’t open after the settings were saved | An argument is blank or not allowed, such as an empty scenario or currency. Open the settings and give each argument a cell or a value. |
| Every copy shows the same figure | A formula on the template names a fixed row, such as D8. Use {row} in its place. |
| A new account has no row | It has nothing for the month in that section, or it isn’t mapped. Check it on the Profit & Loss. |
| {display_name} shows on the page | The sheet no longer grows rows. Set the source again, or type fixed rows. |
Want more detail? See the documentation