
Cell Reports · Track 1 · Tutorial 12 of 12
Use a Cell Report in dashboards and packs
Available on ProPremium
A Cell Report doesn’t have to stay on its own screen. The same report can sit on a dashboard as a card and in an insight package as a section, so the figures you lay out once reach the people who read dashboards and packs.
1Add the report to a dashboard
- Select Dashboard from the left navigation, open the dashboard, and click the Edit icon in the top-right corner.
- Click Add a widget, then Report.
- Set Type to Cell report, and in Cell Report pick the monthly summary.
- Click Add Widget, place and size the card, and click Save.
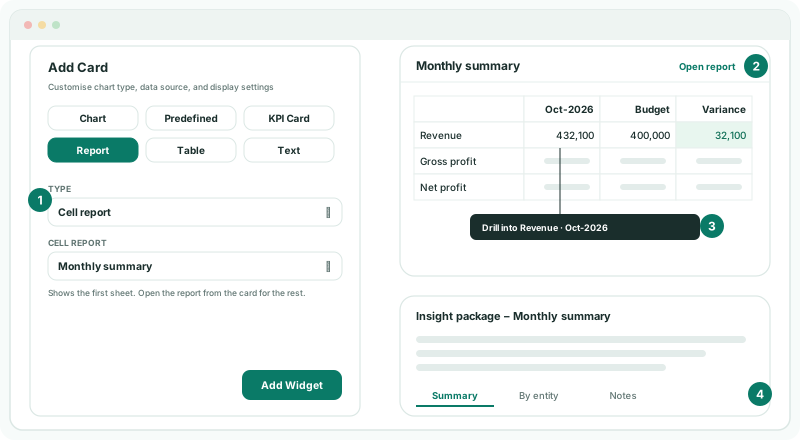
Cell report appears under Type only once your organisation has a Cell Report to pick. The list holds your organisation’s own reports and any shared with it across the subscription.
A card is a fixed-size tile, so it shows the report’s first sheet only. Put the figures you want on the dashboard on the first sheet; readers open the report for the rest.
2See what dashboard readers get
| Figures | The report as saved: cells on Reporting month follow the organisation’s reporting month, fixed months stay fixed, and selection lists use their Selected value. The card doesn’t follow the month or comparison picked on the dashboard. |
|---|---|
| Drill | A bound figure drills from the card to the postings behind it, as it does in View. |
| Open report | Shown only to users who can manage reports, on a plan that includes Cell Reports. Everyone else who can read the dashboard sees the card without the link. |
| Comments | Comments on the card are dashboard comments. Comments on cells stay with the report. |
Check
The card shows the same figures as the report in View with its Selected values. Hover over B4 on the card: it offers Drill into October’s revenue.
3Add the report to an insight package
- Open the monthly insight package in the editor and click Add a section.
- Under From BrizoConsol, choose Cell Report.
- Search for the monthly summary and pick it. Wait for the preview to load, then click Add Section.
- Click Save changes, and Publish when the package is ready.
Unlike the card, a package section keeps every sheet: readers switch between them with the sheet tabs under the grid. The cells are plain values in the package; they don’t drill.
The section reads the report each time the package is opened, so readers see the figures as they are then, not as they were when the section was added. When the package is exported to PDF, every sheet prints, with its charts.
4Keep one report feeding both
The card and the section hold a link to the report, not a copy. Change the report — a new row, a different format, another chart — and the dashboard and package show the change the next time they are opened. There is nothing to update on the dashboard or in the package.
That also means the report decides the entity and the month. To move the card and the section to November, use Reporting month for the period cell and move the reporting month, or change the period cell’s Selected value and save the report. See Let readers choose the entity, period and currency.
Check
Change a heading on the monthly summary and save. Reload the dashboard and open the package: both show the new heading.
5If something goes wrong
| What you see | What to do |
|---|---|
| No Cell report under Type | Your organisation has no Cell Report to pick yet. Create one first. |
| Unable to load this Cell Report. | The reader needs access to the organisation’s reports. Check their rights. |
| The card is missing rows or sheets | A card shows the first sheet only. Move the figures to the first sheet, or use Open report. |
| The card shows another month than the dashboard | The card follows the report, not the dashboard. Change the report’s period cell. |
| There’s no Open report link | It is shown only to users who can manage reports, on a plan that includes Cell Reports. |
Want more detail? See the documentation