
Row/Column Reports · Track 2 · Tutorial 2 of 6
Add variance and formula columns
Calculated columns turn a list of figures into an answer: how far from budget, and in which direction, and how large each line is against revenue. Build them once in a column set, and every report that uses the set has them.
1Add the period columns
- Open Reports → Column Sets, click Add Column Set, and name it Month vs budget.
- Add a System Period column, Current Month, Movement Actual, labelled Actual.
- Add Month % Revenue, Movement Actual, labelled % of revenue.
- Add Current Month, Movement Budget, labelled Budget.
Month % Revenue shows each row as a percentage of the month’s revenue, so revenue itself reads 100%.
2Add the variance
- Choose Formula / Variance as the Column Type, label it Variance, and choose Variance as the Expression Type.
- Under Build Variance, choose Actual from - select an existing column -, click −, and choose Budget.
- Click Add Column.
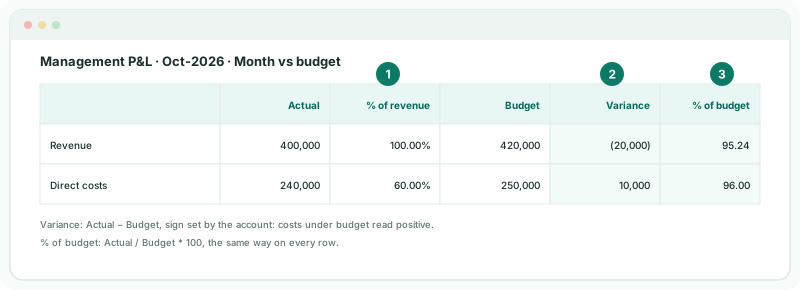
A Variance column flips the sign on accounts that normally carry a debit, such as costs. Actual less budget then reads positive when it is good news on every row: revenue 20,000 under budget shows (20,000), direct costs 10,000 under budget show 10,000.
3Add a formula column
- Add another Formula / Variance column, labelled % of budget, with the Expression Type Formula.
- Under Build Formula, choose Actual, click /, choose Budget, click *, and add the fixed value 100.
- Click Add Column, then Create Set.
A Formula column works the result out as written, on every row, with no sign change. Revenue of 400,000 against a budget of 420,000 shows 95.24.
4Use the set
- Choose the set as the Management P&L’s Period, under Column Set, and click Save, then View.
Check
For each row, Variance is Actual less Budget, positive when the row did better than budget. % of budget is Actual divided by Budget times 100. Revenue’s % of revenue is 100%.
5If something goes wrong
| What you see | What to do |
|---|---|
| The variance has the opposite sign on costs | It is a Formula column. Choose Variance as the Expression Type. |
| Budget and the calculated columns are empty | No budget is loaded for the month. Load it. |
| % of budget shows 0.95 | The formula is missing * 100. Add it, or read the figure as a ratio. |
Want more detail? See the documentation