
Operational Data · Track 3 · Tutorial 6 of 7
Start a model from the Search Console or Harvest template
Search traffic and billable hours mean most beside the revenue they lead to. The two connector templates set up the sources, dimensions and metrics for you, including the ratios and how they total.
1Find the templates
- Connect the source first: Connect Google Search Console, or Connect Harvest for time.
- Select Your Group, open Organisation Settings → Business Data Builder, and click New Model.
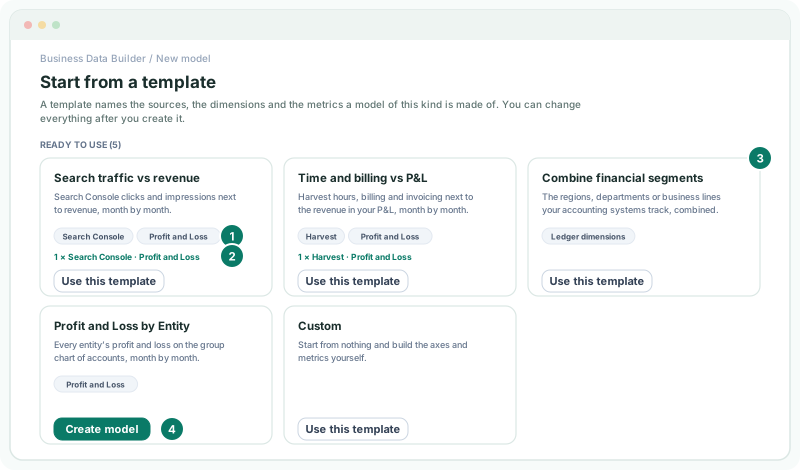
A template is listed under Ready to use when the group holds the data it needs, and under Needs a source with a link to connect it when it doesn’t.
| Template | Reads | Builds |
|---|---|---|
| Search traffic vs revenue | Search Console, and the Profit and Loss | Clicks, Impressions, CTR, Average position, Revenue and Revenue per click, month by month. |
| Time and billing vs P&L | Harvest, and the Profit and Loss | Tracked hours, Billable hours, Utilisation, Billable amount, Invoiced, Unbilled, Revenue and Revenue per billable hour. |
2Fill in Search traffic vs revenue
- On Search traffic vs revenue, click Use this template.
- Under 1 · Sources, tick each Search Console dataset to read. The Profit and Loss is read for every entity of the group.
- Under 2 · Dimensions, tick Country or Device if you want the search figures split by them.
- Under 3 · Metrics, leave the metrics ticked, enter a Model name, and click Create model.
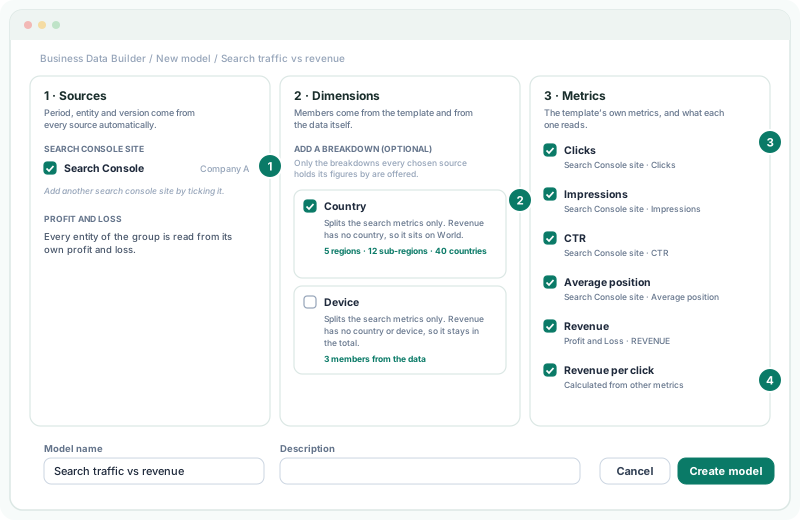
Revenue has no country or device. With Country, revenue sits on World, the member every region rolls up into; with Device, it stays in the total. CTR and Average position are weighed by Impressions, and Revenue per click is worked out from the totals.
3Fill in Time and billing vs P&L
- Back on New Model, click Use this template on Time and billing vs P&L.
- Tick each Harvest dataset to read, and tick Client, Project or User if you want the Harvest figures split by them.
- Enter a Model name, and click Create model.
Revenue has no client, project or user, so it stays in the total. Utilisation is Billable hours over Tracked hours, Unbilled is Billable amount less Invoiced, and Revenue per billable hour is Revenue over Billable hours, each worked out from the totals.
4Check the models
- Each model opens on its model page. When the badge reads Up to date, click View.
Check
In the search model, Clicks for a month equal the Search Console dataset’s clicks for the month.
Everything a template set up can be changed afterwards on the model page, like any other model.
5If something goes wrong
| What you see | What to do |
|---|---|
| The template is under Needs a source | Connect the source, and let its dataset load. |
| A breakdown isn’t offered | Only the breakdowns every chosen source holds its figures by are offered. Add that breakdown to the dataset. |
| Revenue doesn’t split by country | Expected: the profit and loss has no country, so revenue sits on World. |
Want more detail? See the documentation