
Operational Data · Track 3 · Tutorial 5 of 7
Combine financial segments across accounting systems
Each accounting system tracks segments its own way, and each entity names them its own way: North in Xero, N. Region in QuickBooks. Combine financial segments puts them on one dimension of yours, so the group reads its profit and loss by region across every entity.
1Start the template
- Bring in each entity’s segments first, as in Bring in tracking categories, classes, jobs and tags. In this example, Company A keeps Xero Tracking: Branch and Company B keeps QuickBooks: Class.
- Select Your Group, open Organisation Settings → Business Data Builder, click New Model, and click Use this template on Combine financial segments.
The template is offered under Needs a source until at least one entity’s segments have been brought in.
2Pick the segments to combine
- Under Which ledgers?, tick Xero Tracking: Branch (Company A) and QuickBooks: Class (Company B). Any mix of Xero, QuickBooks, MYOB and Zoho works.
- Click Next.
3Name the segment
- Enter Region as the Dimension name: what the figures are grouped by.
- Enter Regional P&L as the Model name, or leave it empty and the model takes the dimension’s name. Click Next.
4Match options
The members open with one row for each option the ledgers hold. Company A says North and South; Company B says N. Region, S. Region and Corporate.
- Rename the North row if needed, and put N. Region from QuickBooks: Class in it beside Xero’s North.
- Do the same for South and S. Region, and remove the rows left empty.
- Keep Corporate as its own member.
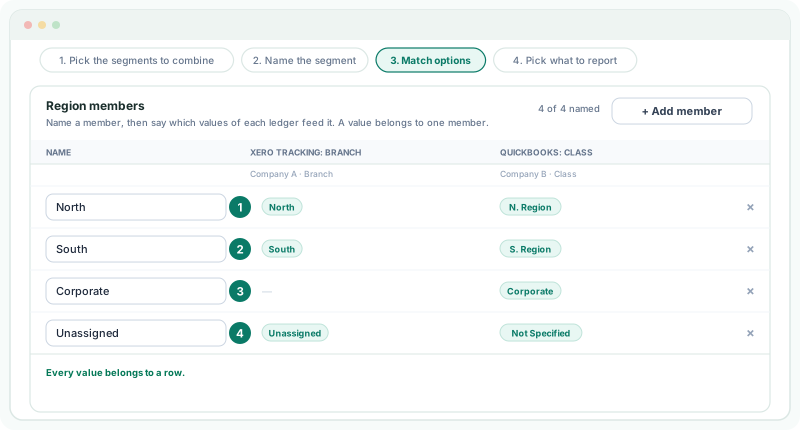
A value belongs to one member, and several values can feed one. Anything left below the table sits on Unassigned, and each system’s own no-segment value (Xero’s Unassigned, QuickBooks’ Not Specified) belongs there too, so the totals still agree with the ledgers.
Check
The count reads 4 of 4 named, and the table says Every value belongs to a row.
5Pick what to report
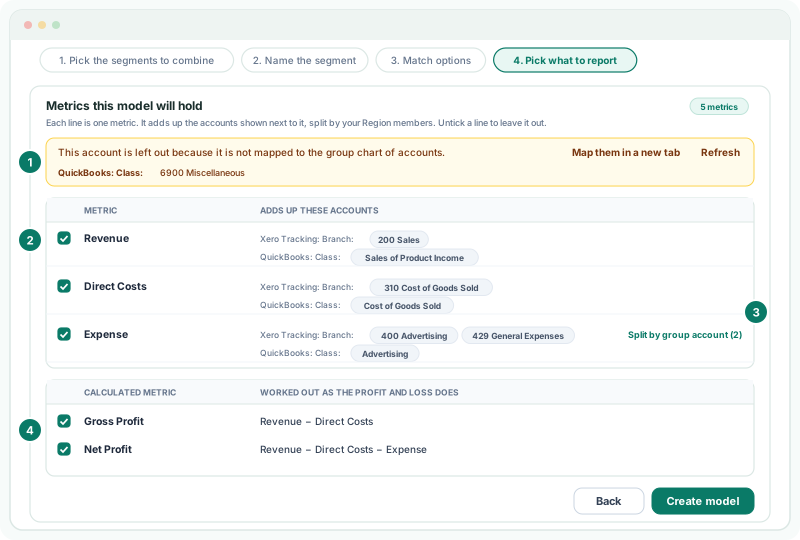
Each line is one metric. It adds up the ledger accounts mapped into one section of the group chart of accounts, split by Region. The totals the profit and loss works out between them are offered as calculated metrics.
| Action | What it does |
|---|---|
| Untick a line | Leaves that metric or total out. |
| Split by group account | Replaces the section with one metric per group account in it. Combine into one metric puts it back. |
| Map them in a new tab | Opens Account Mapping for accounts not mapped to the group chart. Map them, come back, and click Refresh; your choices are kept. |
- Map any account the warning lists, click Refresh, then click Create model.
6Check the model
- The model page opens and starts loading. When the badge reads Up to date, click View.
Check
Revenue for North in a month is Company A’s North revenue plus Company B’s N. Region revenue. With every account mapped, Net Profit across all regions, Unassigned included, equals the two entities’ Net Profit.
7If something goes wrong
| What you see | What to do |
|---|---|
| No ledger dimensions found | Bring in an entity’s segments first. |
| Next stays greyed out | Each step needs its choice: a ledger, a dimension name, every member named, at least one metric. |
| Figures are missing for an account | It is not mapped to the group chart of accounts. Map it and click Refresh. |
| Too much sits on Unassigned | Put the values left below the table into members. |
Want more detail? See the documentation