
Operational Data · Track 3 · Tutorial 1 of 7
Read a model: Profit and Loss by Entity
The Business Data Builder puts operational data and financial statements into one model, on dimensions you define. Profit and Loss by Entity needs no choices at all, so it is the quickest way to see how a model is made before you build one of your own.
1Create the model
- Select Your Group and open Organisation Settings → Business Data Builder.
- Click New Model. The Start from a template page opens.
- Under Ready to use, find Profit and Loss by Entity and click Create model. There is nothing to choose: the model is created and opens straight away.
The model starts loading its data in the background, and the badge beside its name reads Loading data until it finishes. If the group already has a model of this name, the new one is named Profit and Loss by Entity 2.
Check
After a short while the badge reads Up to date.
2Read the model page
The model page shows what the model is made of. Its one source is the profit and loss of every entity, on the group’s accounts. The template has already linked each line of that statement to a metric of the same name.
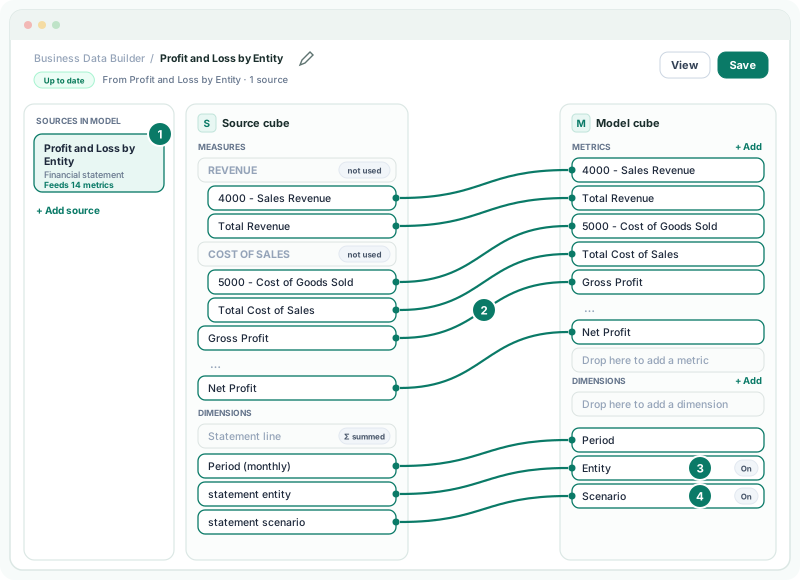
| Part | What it holds |
|---|---|
| Sources in model | One source, the profit and loss read for every entity of the group on the group chart of accounts. |
| Source cube | The statement’s lines: each section, its accounts and its total, and the totals down to Net Profit. A line no metric reads is marked not used. |
| Model cube · Metrics | One metric for each group account the entities’ profit and loss prints, each section total, and Gross Profit down to Net Profit. Every one totals by Sum and reads as Currency. |
| Entity | On: each entity’s figures stay apart. |
| Scenario | On: Actual, Budget and Forecast are each read as the statement prints them, and never added together. |
A line is a link. Click one to see what it reads; nothing changes until you click Save.
3Read the figures
- Click View at the top of the model page. The model’s figures open in the operational report viewer, like any other operational data.
- Put Entity on the rows and the metrics on the columns, and choose a month. See Read and export an operational report for the viewer itself.
Check
For one entity and one month, Net Profit in the model equals the Net Profit on that entity’s profit and loss for the month.
The model reads the statements for the most recent 36 months the group has data for. A model does not keep figures of its own: they are written to the operational dataset it publishes, so dashboards, reports and KPIs read them too.
4Look after it from the Models list
Back on Organisation Settings → Business Data Builder, every model of the organisation is listed with the template it came from and the state of its data.
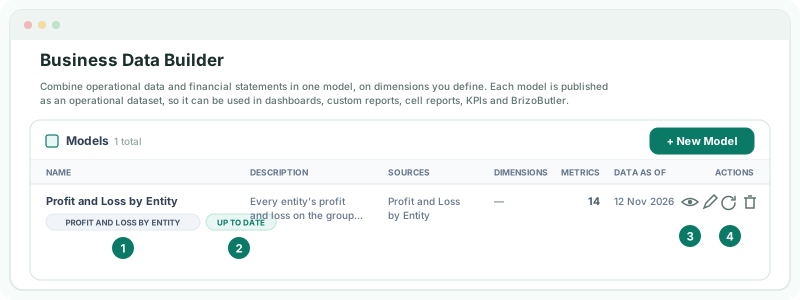
| Badge | Meaning |
|---|---|
| No data yet | The model has not loaded its data. |
| Loading data | The data is loading. The list updates by itself. |
| Up to date | The data has loaded. Data as of shows when. |
| Data load failed | The last load did not finish. Hover over the badge to see why. |
The model refreshes by itself when the consolidation recalculates. Click the refresh icon to load it now, the pencil to open the model page, and the bin to delete the model with the dataset it published.
5If something goes wrong
| What you see | What to do |
|---|---|
| Business Data Builder isn’t in Organisation Settings | It needs Administrator or Data Loading Admin access. |
| The page asks you to upgrade to Premium | The Business Data Builder is included in Premium and the trial. |
| View is greyed out | The model has not published its data yet. Wait for Up to date. |
| Data load failed | Hover over the badge to read why, then click Refresh data. |
| A new group account is not among the metrics | The metrics are the accounts the entities’ profit and loss printed when the model was created. Add a metric for the new account on the model page, and link its line to it. |
Want more detail? See the documentation