
Operational Data · Track 3 · Tutorial 2 of 7
Build a custom model
A custom model starts from nothing: you choose the sources and decide what each one feeds. Here, units sold from two companies meet the revenue in the profit and loss, so the group can read units, revenue and revenue per unit in one place.
1Start a custom model
- Select Your Group, open Organisation Settings → Business Data Builder, and click New Model.
- On Custom, click Use this template.
- Enter Units and revenue as the Model name, add a Description if you like, and click Create model. The model page opens, with no sources yet.
A model name must not be used by another model or by an operational dataset of the organisation.
2Add the sources
- Click + Add source under Sources in model. Under Financial statements, choose Profit & Loss.
- Click + Add source again and, under Operational data, choose Units sold of Company A.
- Add Units sold of Company B the same way.
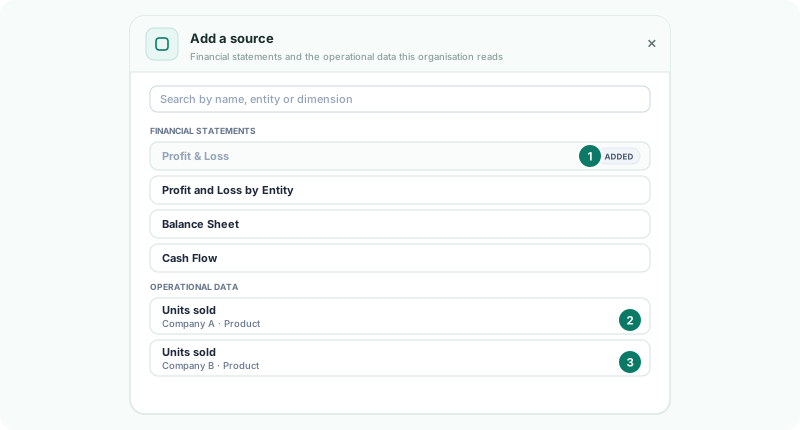
Each company’s dataset is its own source, so the model reads both and adds them together. The sources wait on the page as unsaved changes; nothing is written until Save.
3Keep each entity apart
- In the Model cube, click Entity and tick Entity in model.
- Leave Scenario off. Each source is then read for one scenario, Actual.
4Link the units
- Choose Units sold of Company A on the left.
- In the Model cube, click + Add beside Metrics, choose Metric, and name it Units sold.
- Click Value in the Source cube, then the Units sold metric. A line joins them.
- Drag Product from the Source cube onto Drop here to add a dimension. A Product dimension is created from the dataset’s products, and linked to the field with Auto matching.
- Choose Units sold of Company B. Click Value, then Units sold; click Product, then the Product dimension, check the matches, and click Apply.
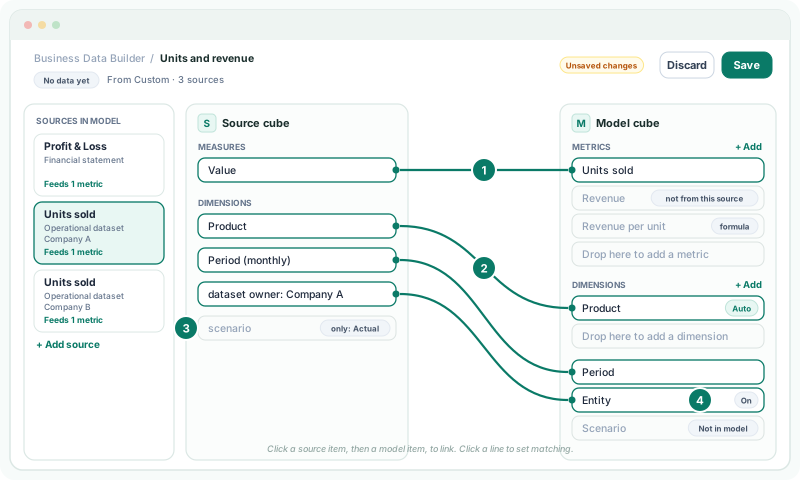
If Company B names its products differently, see Match source values to dimension members.
5Link the revenue
- Choose Profit & Loss on the left.
- Add a metric named Revenue, then click the line that holds your revenue in the Source cube (for example, the revenue total), then Revenue.
- In the metric panel, set Format to Currency.
The profit and loss has no products, so Product is not filled by this source and its revenue sits on Unassigned. To put it in a member instead, click the Product dimension and choose one under Put all of Profit & Loss’s data in.
6Add the ratio
- Click + Add beside Metrics, choose Formula metric, and name it Revenue per unit.
- Click Edit formula, build Revenue / Units sold, and click Done.
A formula metric is worked out after the figures are totalled, so a quarter’s revenue per unit is the quarter’s revenue divided by the quarter’s units. See Choose how a model’s metrics total.
7Save and check
- Click Save. The whole model is written at once and starts loading its data.
- When the badge reads Up to date, click View.
Check
At Your Group, Units sold for a month is Company A’s plus Company B’s. Revenue per unit, read without Product on an axis, is Revenue divided by Units sold for the month.
8If something goes wrong
| What you see | What to do |
|---|---|
| A source says Feeds no metric yet | Nothing reads it. Link one of its measures to a metric, or remove it. |
| This organisation already has a model called … | Choose another name. |
| Leaving the page asks Leave without saving? | There are unsaved changes. Stay and click Save, or Discard and leave. |
| Revenue per unit is blank for a product | Revenue is not split by product; read the ratio without Product, or by entity. |
Want more detail? See the documentation