
Operational Data · Track 2 · Tutorial 8 of 8
Read and export an operational report
Every operational dataset, uploaded or written from an accounting system, opens as a report from the Reports page. You choose what runs down the rows and across the columns, and every figure can be opened to the rows behind it.
1Open the report
- Open Reports → All Reports and find Operational Data.
- Click the Units sold card. Click its star to keep it in your Favourites.
The report opens on the fiscal year to date. Its address carries the layout and filters, so a reload or a shared link opens the same view.
2Arrange it
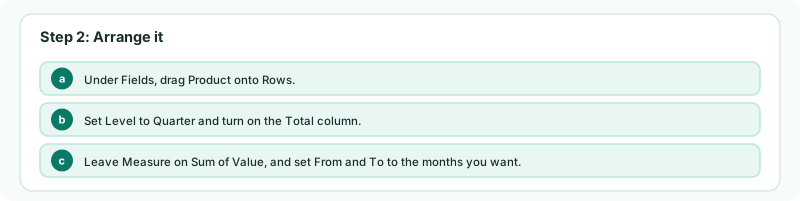
- Under Fields, drag Product onto Rows.
- Set Level to Quarter and turn on the Total column.
- Leave Measure on Sum of Value, and set From and To to the months you want.
The measures are Sum of Value, Count of rows and Average of Value. To filter a field, click its funnel and choose Only selected or Everything but selected, or a text rule for a long list, then Keep filter.
3Check a figure
- Click a figure. The rows behind it are listed beneath it, with their total. Click it again to close the list.
Check
The rows listed under a figure add up to it, and each falls in that row’s product and that column’s quarter.
Up to 1,000 rows are listed.
4Export or share it
- Click Export to PDF or Export to Excel in the page header for the view on screen.
- Or click Add to Insight Package, choose a package under Select Package or Create a new Insight Package, and add the report as a section with its layout and filters.
5If something goes wrong
| What you see | What to do |
|---|---|
| No rows answer this figure. | The figure is empty for that cell. Check the filters and the period range. |
| The total column is missing a field’s total | No total is built across a connector dataset’s P&L lines, so lines are never added to each other. |
| There is no Add to Insight Package | You don’t manage Insight Packages. Ask someone who does. |
Want more detail? See the documentation