
Operational Data · Track 2 · Tutorial 2 of 8
Consolidate datasets across companies
Each company loads its own operational data, and the group reads it as one. That only works when the companies’ datasets match, so a dashboard or report at group level can add them together without counting anything twice.
1Create matching datasets
- Select Company A, open Operational Data, and create Units sold with one dimension, Product, as in Create a dataset and upload a CSV.
- Select Company B and create the same dataset with the same settings, then upload each company’s own file.
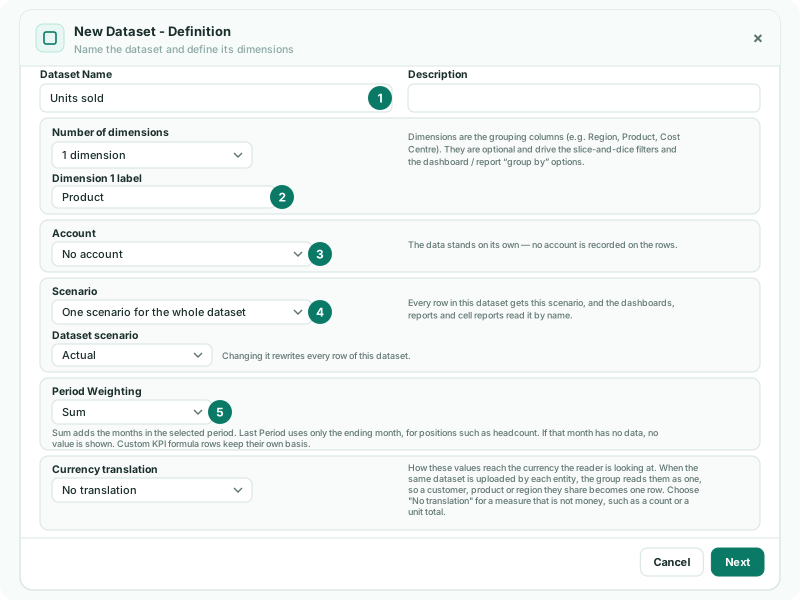
The group reads datasets from different companies as one source only when all of these match:
| Must match | Note |
|---|---|
| Dataset Name | Capitals and spaces at the ends are ignored. |
| Dimension labels | The same labels in the same order. |
| Scenario | The same one scenario, or both taking it from a Scenario column. |
| Account | The same Account setting. |
| Period Weighting | Both Sum, or both Last Period. |
The values inside a dimension should match too: a product both companies call Widgets becomes one row at group level, while Widget and Widgets stay two.
2Read it at group level
- Select Your Group and open Operational Data: both companies’ datasets are listed, read-only.
- In a dashboard, choose Units sold as a data source: it is one source covering both companies.
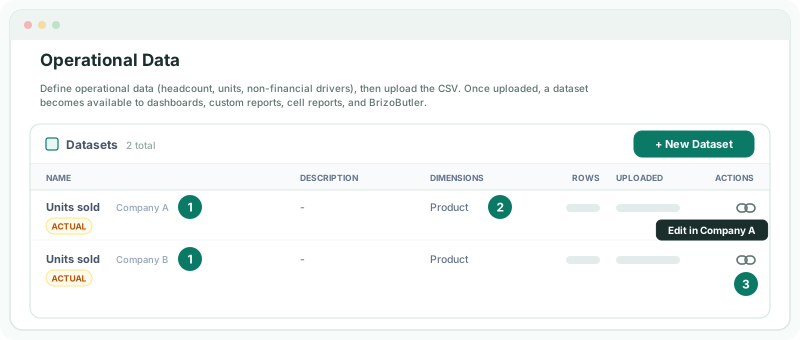
Check
At group level, Widgets for October is Company A’s Widgets plus Company B’s. In a row/column report, the row’s Include Entities lists both companies.
A money dataset is translated company by company before the figures are added. See Translate money datasets into the group currency.
3If something goes wrong
| What you see | What to do |
|---|---|
| The group shows two Units sold sources | A setting differs between the companies. Compare their definitions and make them the same. |
| A company’s figures are missing | Its dataset has no rows yet, or is not in the group. Upload its data. |
| A company’s figures don’t match what you uploaded | It has two matching datasets. Only the newest is read; delete the old one so the list is clear. |
Want more detail? See the documentation