
Dashboards and KPIs · Track 2 · Tutorial 1 of 3
Build a custom dashboard
The built-in dashboards answer general questions. A custom dashboard answers yours, with the cards your management team asks about each month, laid out the way they read them.
1Start the dashboard
- Open Dashboards → Custom, and click Add a new dashboard.
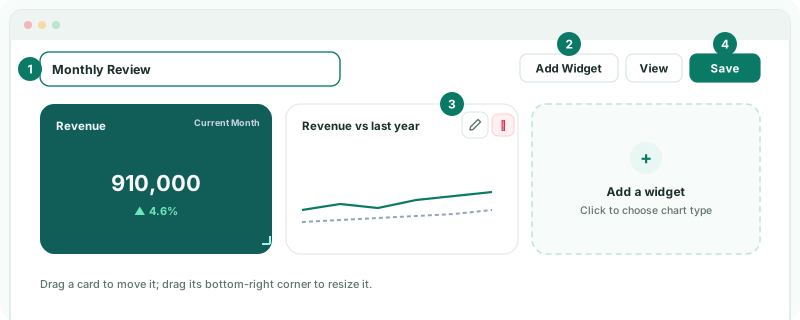
- In Dashboard name..., type Monthly Review.
To start from a ready layout instead, click Template Start, choose a template, such as KPI Overview, Revenue Trend, Cashflow Analysis, P&L Summary or Balance Sheet Snapshot, and click Use This Template. More templates appear when your companies connect to Xero, QuickBooks or Zoho.
2Add the cards
- Click Add Widget, or the Add a widget tile.
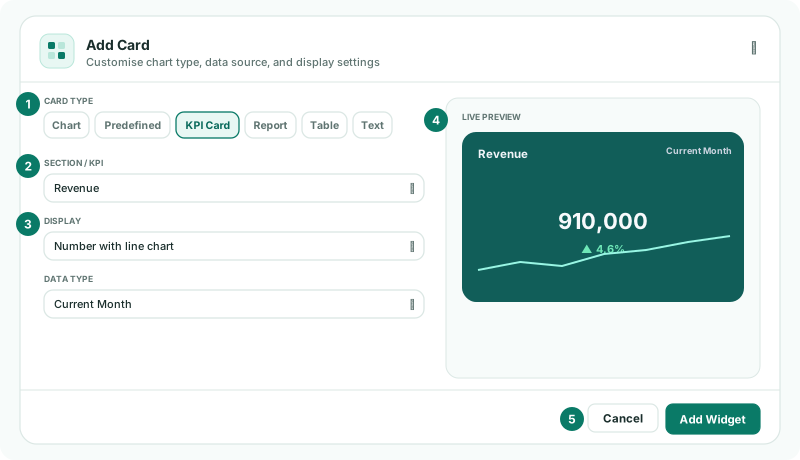
- In Add Card, choose the Card Type, set it up, check the Live Preview, and click Add Widget.
| KPI Card | Section / KPI: Revenue. Display: Number with line chart. |
|---|---|
| Chart | Title Revenue vs last year, Chart Type Line, Data Source Section, dataset REVENUE, Period vs Last Year, Data Type Movement. |
| Table | Table Type Revenue by Account, Top Top 10. |
| Text | Text Type Comment. |
Which card suits which measure is covered in Choose the right widget for each measure.
3Lay it out
- Drag a card to move it, and drag its bottom-right corner to resize it.
- Click the pencil on a card to change it in Modify Card, then Save Widget. Click the red X to remove it.
Nothing is kept until you save.
4Save and view
- Click Save.
- Click View.
The dashboard is listed under Dashboards by its name, for everyone who can read dashboards on the company. On Dashboards → Custom, Edit opens it again and Delete removes it. Saving it under a new name renames it, and its schedules move with it.
Check
Monthly Review appears under Dashboards. Its Revenue card shows the same figure as Revenue on the Main dashboard for the month.
5If something goes wrong
| What you see | What to do |
|---|---|
| Dashboard name is required. | Type a name before you save. |
| The name is already in use | Another custom dashboard has this name. Choose another. |
| No reports available. Create a custom report first, then add it as a widget. | Build a custom report, then add the Report card. |
| Select dataset(s) to preview | Pick at least one dataset for the chart. |
| Free Plan Limit Reached | The Free edition’s one custom dashboard is used. Subscribe, or delete the dashboard you no longer need. |
Want more detail? See the documentation