
Operational Data · Track 2 · Tutorial 5 of 8
Bind operational data in Cell Reports
In a Cell Report, any cell can show one operational figure: units sold of one product in one month, or headcount in one department. Point the choices at other cells and the figure follows the reader’s selection.
1Bind a cell
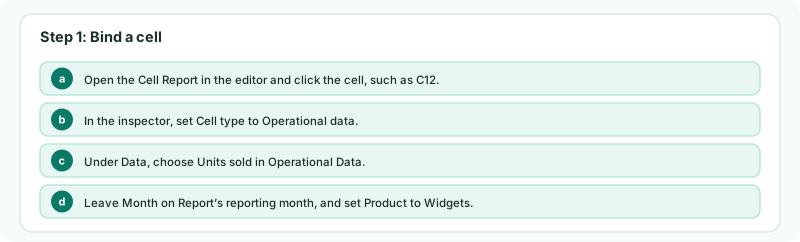
- Open the Cell Report in the editor and click the cell, such as C12.
- In the inspector, set Cell type to Operational data.
- Under Data, choose Units sold in Operational Data.
- Leave Month on Report’s reporting month, and set Product to Widgets.
Each dimension has its own choice, All unless you pick a value. Scenario appears when the dataset holds more than one, and Account when its rows carry accounts. When several companies have a dataset of the same name, the list also offers the plain name, which reads them all added together; a dataset of another company shows that company in brackets.
Check
Change the report’s month: C12 shows that month’s Widgets units, as on the dataset page for the same month.
2Drive it from another cell
- Type Gadgets in B12.
- Click C12, tick Cell reference beside Product, and type B12.
Month, each dimension and Account can each read a cell, so one column of product names can drive a whole table. A cell reads one month: for a quarter, add three cells or use a formula.
3If something goes wrong
| What you see | What to do |
|---|---|
| Custom data bindings require a dataset. | Choose a dataset under Operational Data. |
| The cell shows no figure or 0 | No row matches the month and values chosen. Check the month and the spelling in the referenced cell. |
| Cell-based report is Unavailable for this plan | Cell Reports need the Free, Pro or Premium edition. |
Want more detail? See the documentation